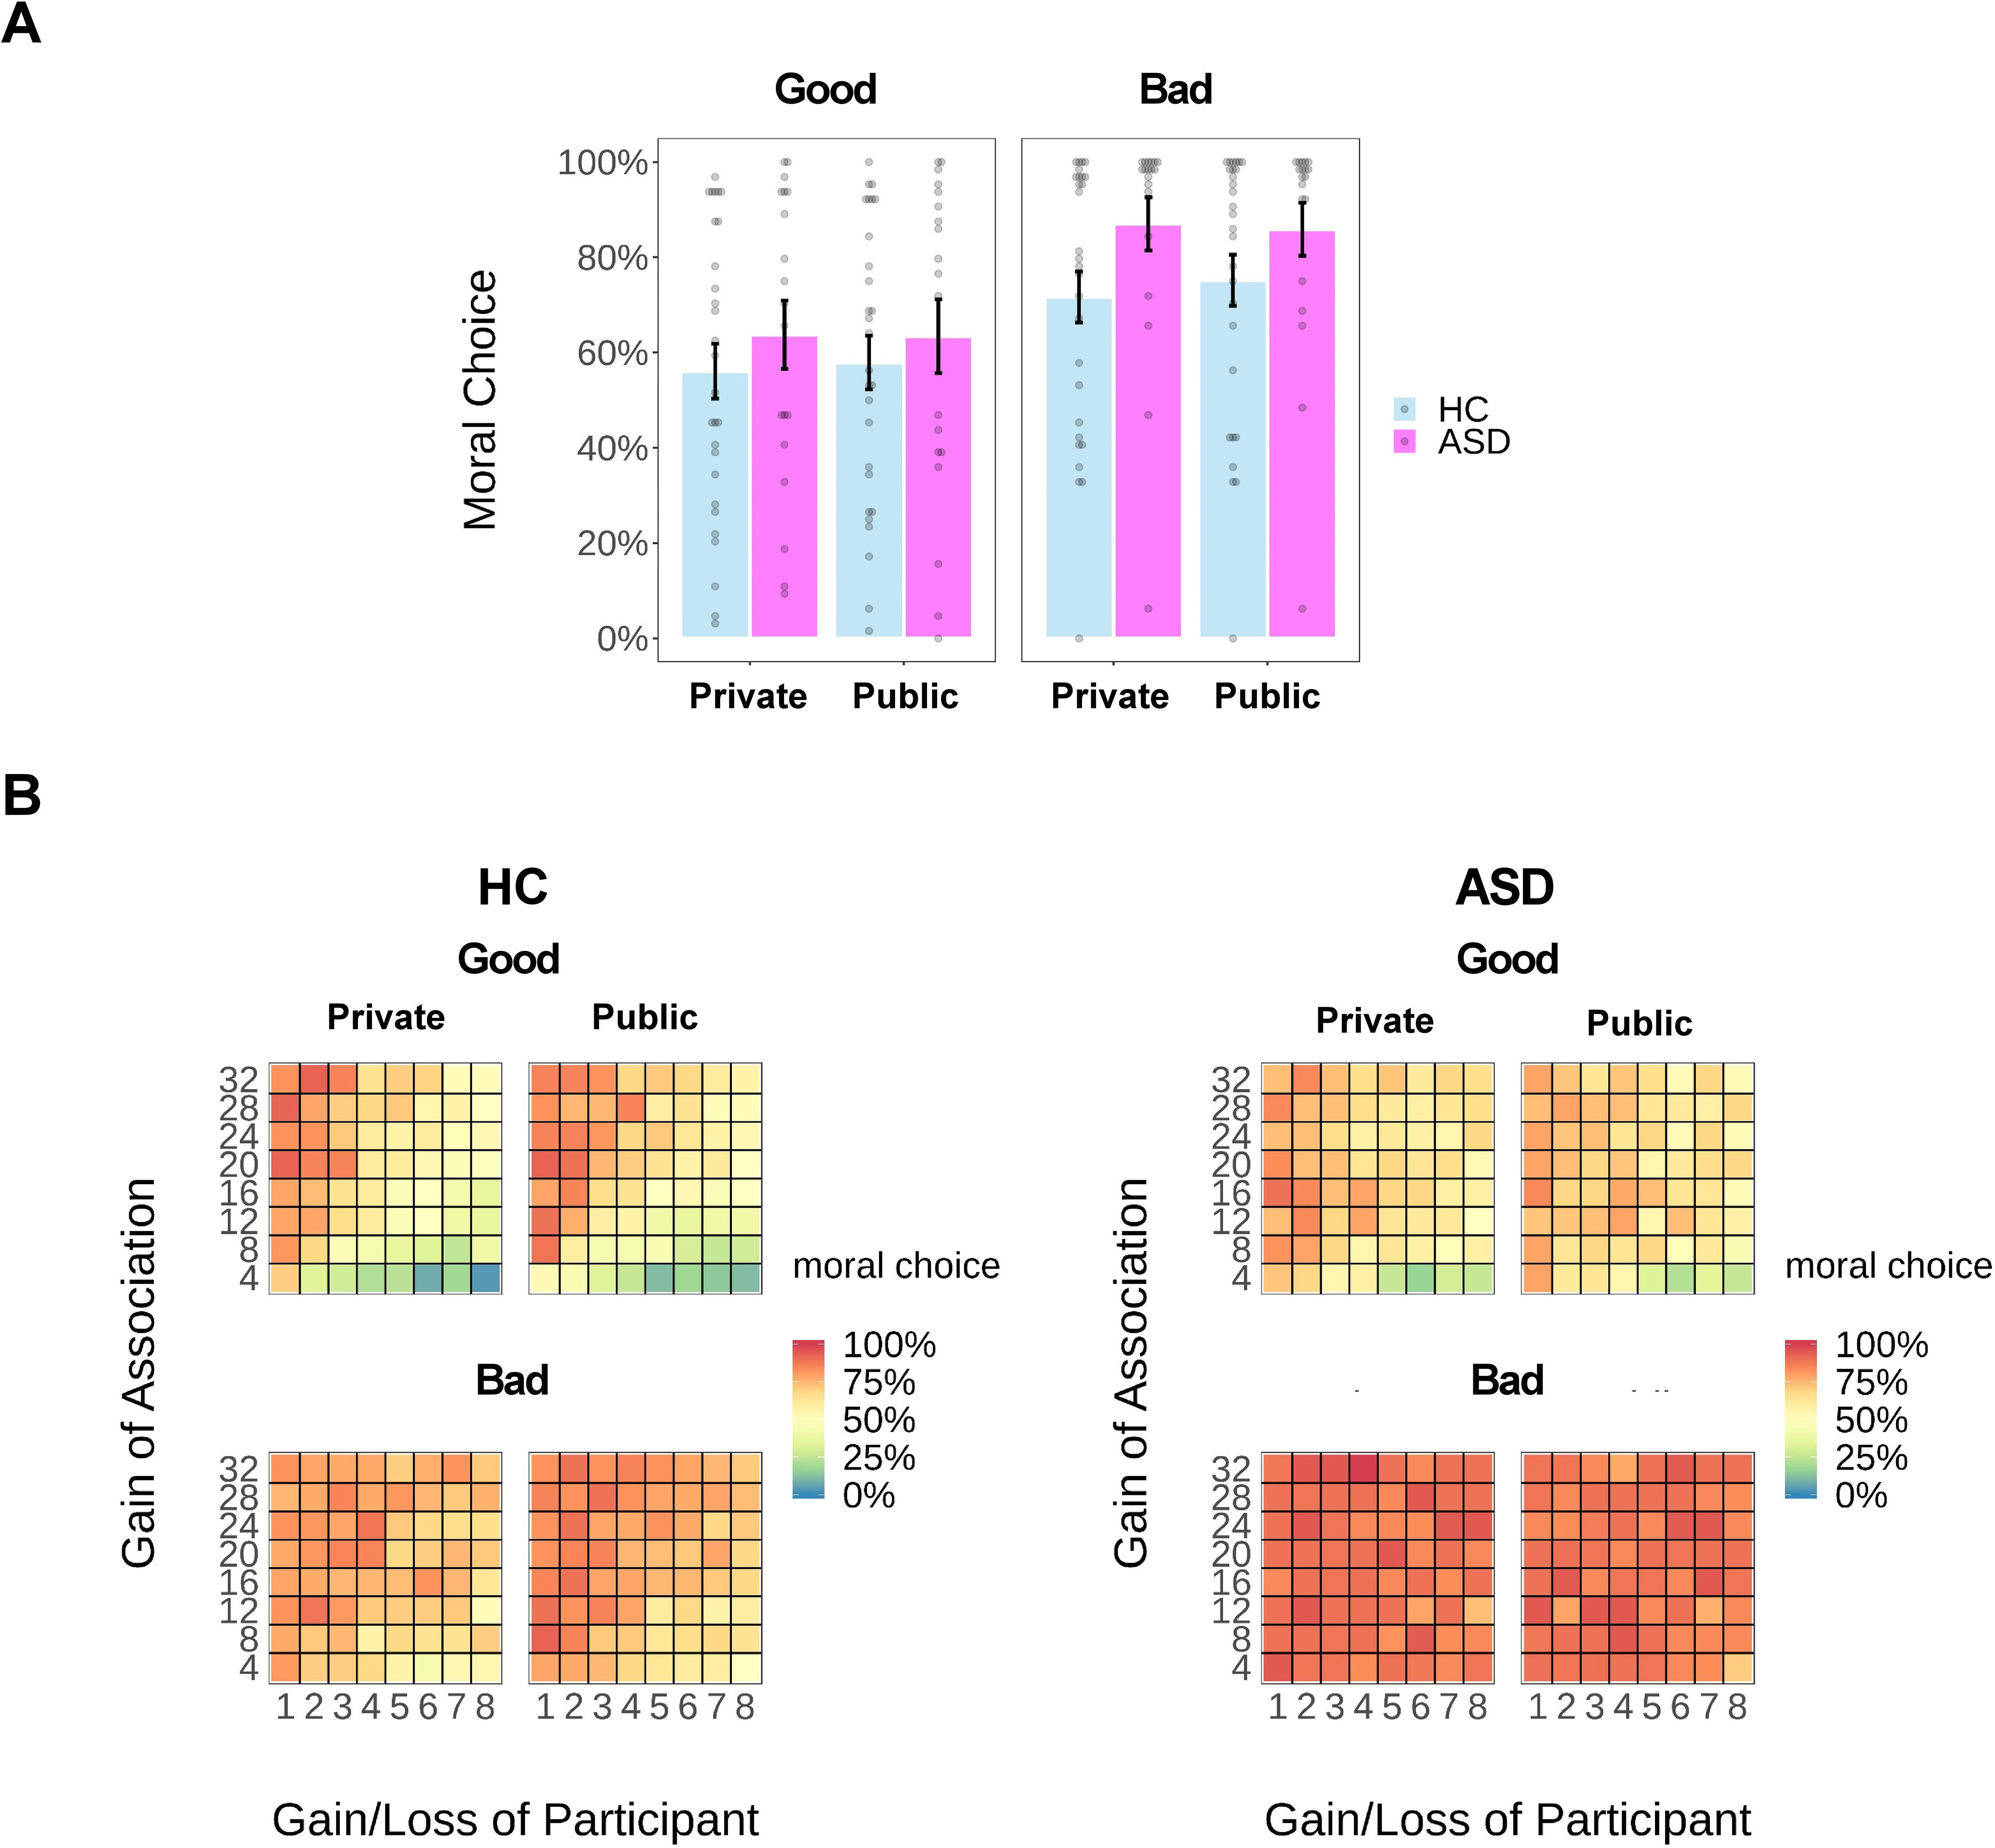
Figure 2.

Results of choice behavior. A, Rate of choosing the moral option as a function of group (ASD or HC), reputation (Private or Public), and context (Good or Bad). B, Heat map of the mean proportion (percentage) of moral choices as a function of payoffs (monetary units) for participants and for associations in each experimental condition for each group. Each dot represents the data of a single participant. Error bars represent the SEM.
