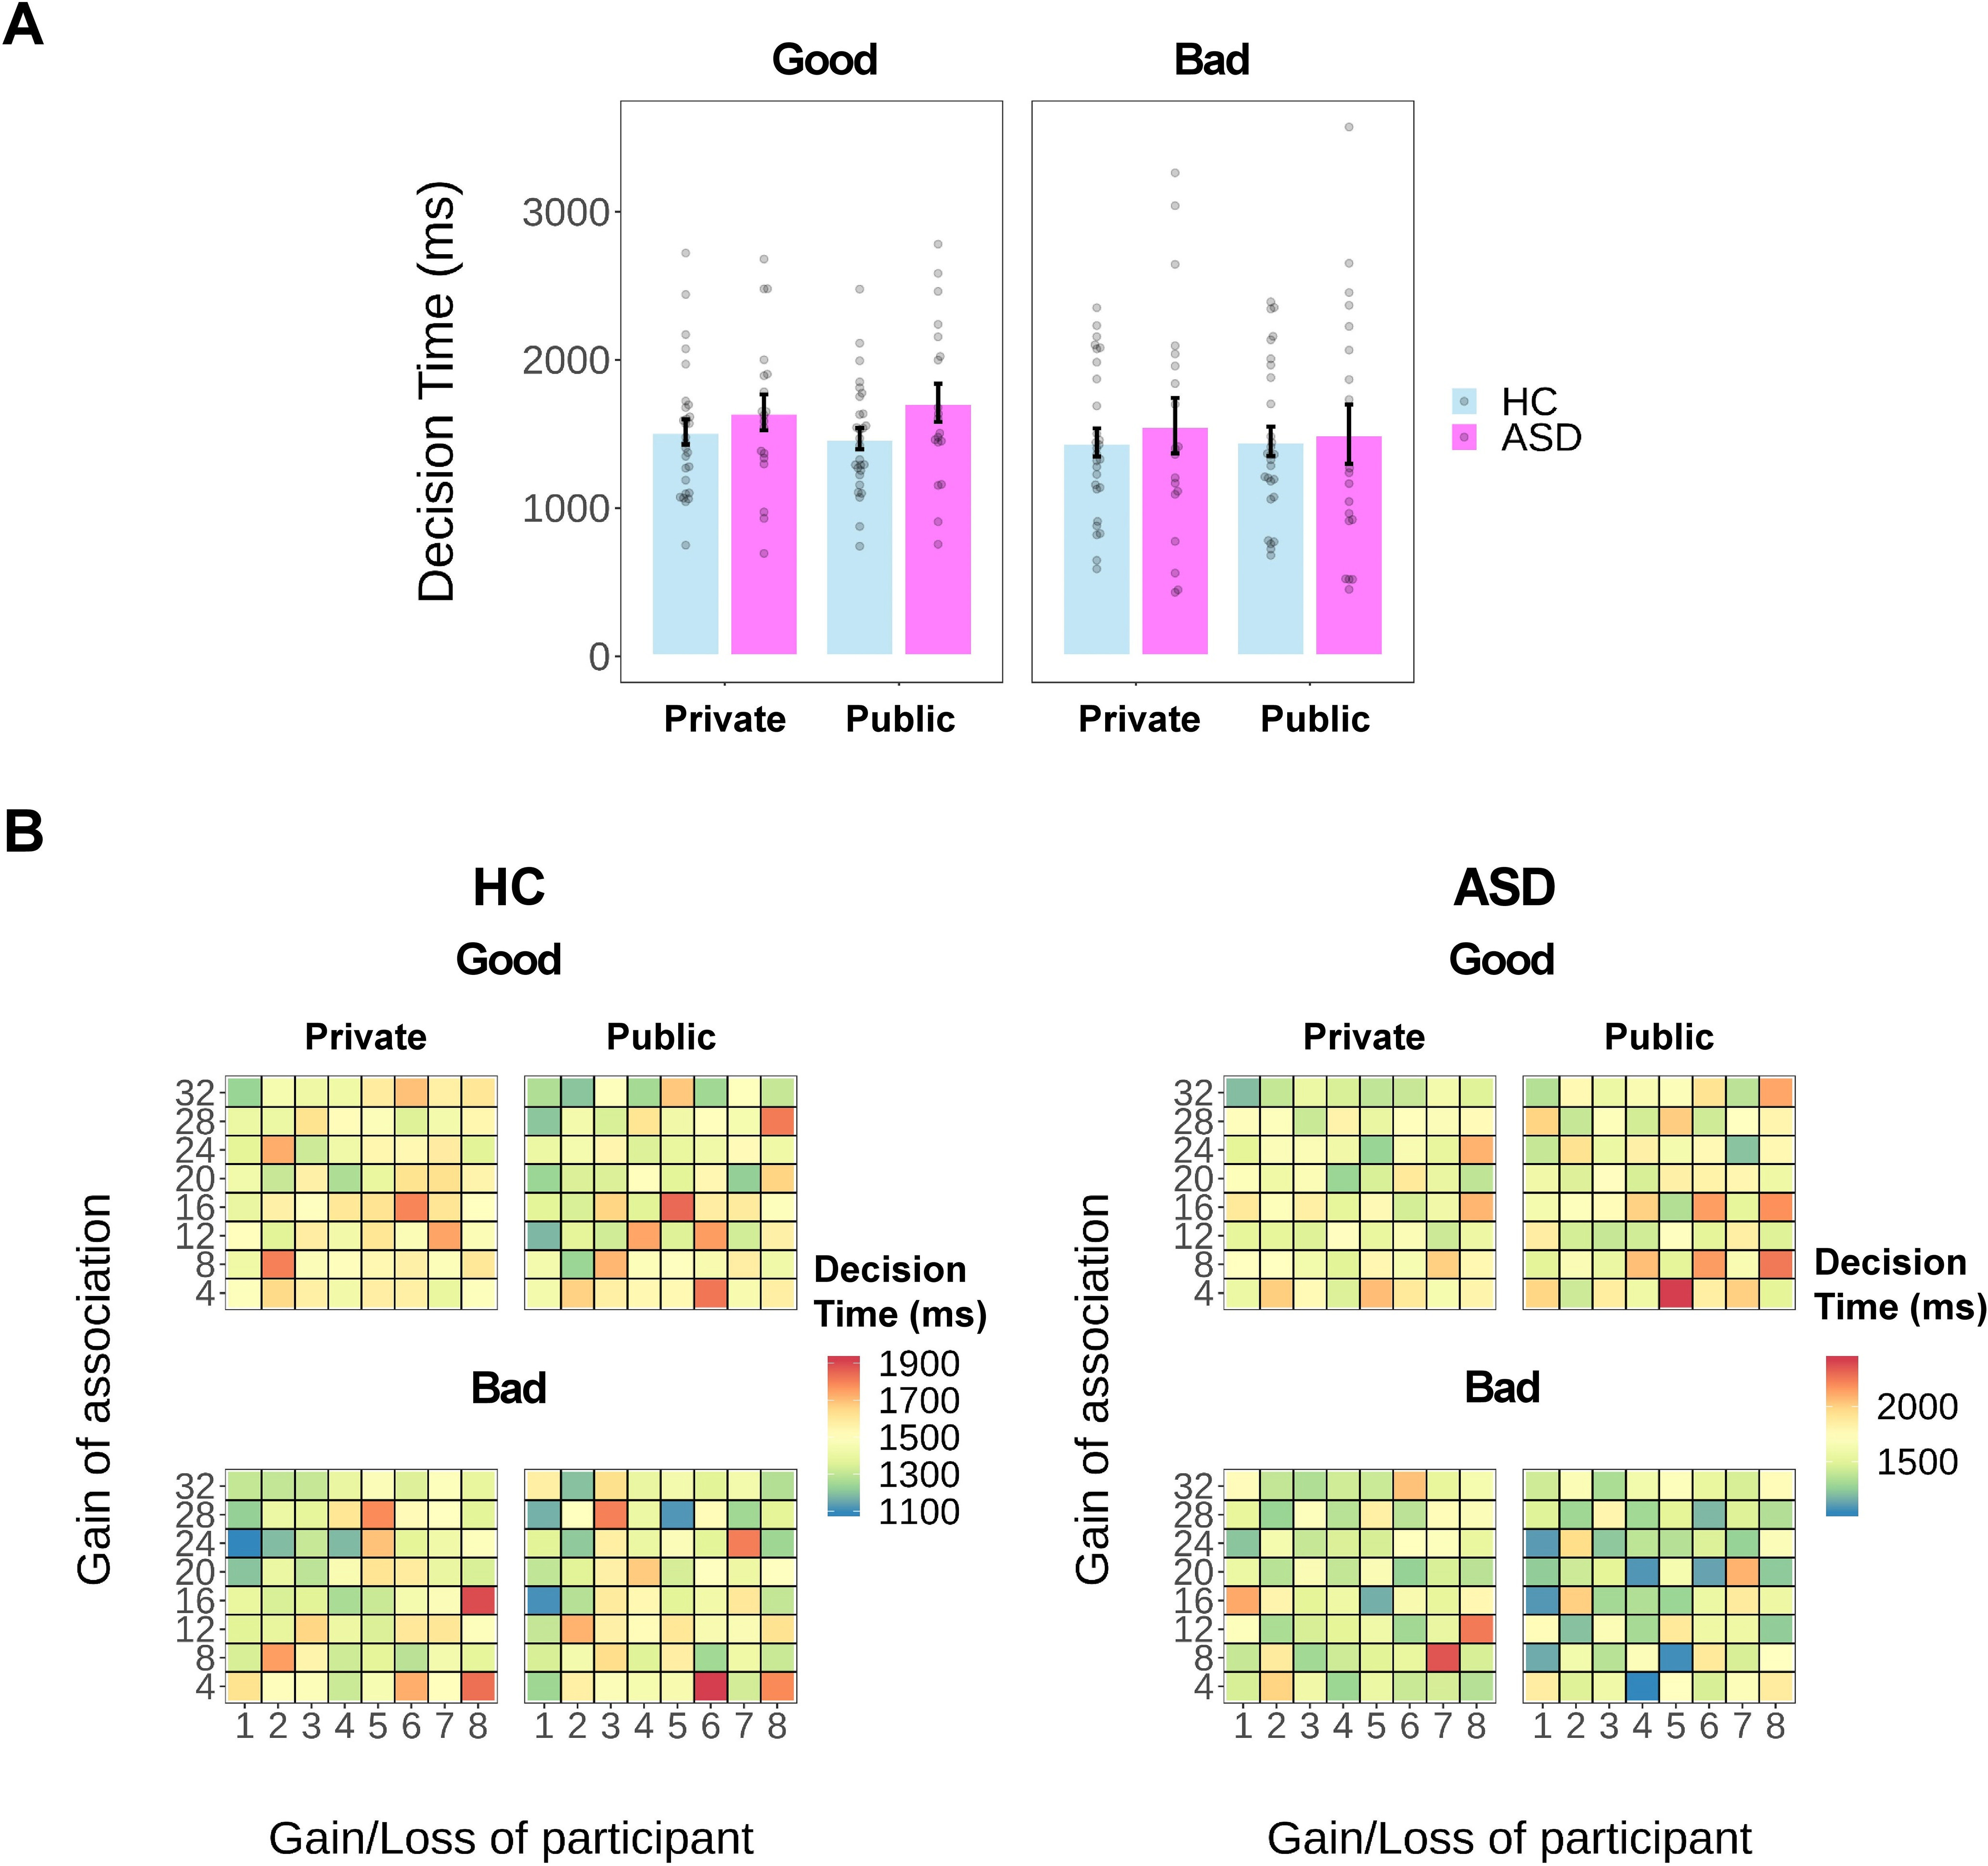
Figure 5.

Results of decision time (in milliseconds). A, Bar plot of the mean decision time as a function of group (ASD or HC), reputation (Private or Public), and context (Good or Bad). B, Heat map of the mean decision time regardless of specific choices as a function of payoffs (monetary units) for participants and for associations in each experimental condition of each group.
