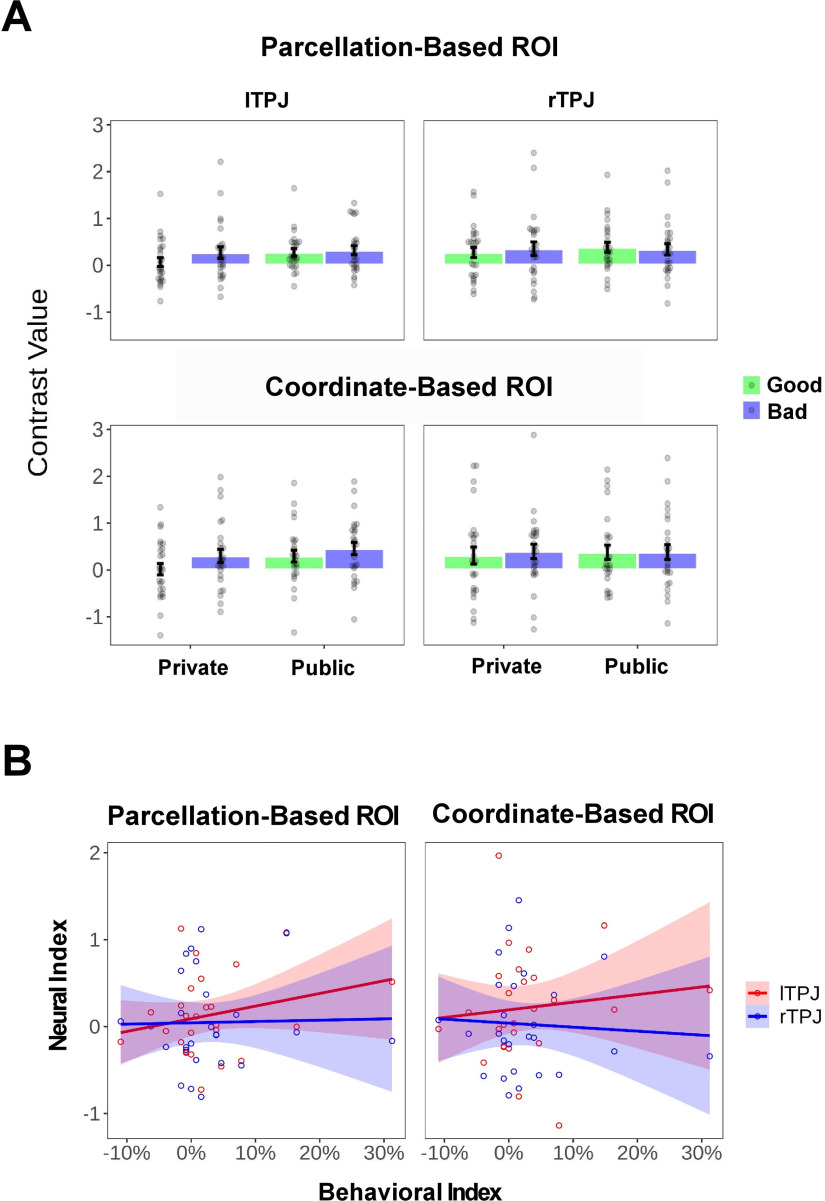
Figure 9.
Univariate results of TPJ in healthy control subjects. A, Bar plot of TPJ signals. For visualization, we extracted the mean activity (contrast value) of lTPJ and rTPJ from the parcellation-based or coordinate-based mask as a function of reputation (Private or Public) and context (Good or Bad). Each dot represents the data of a single participant. Error bars represent the SEM. B, Relationship between neural audience effect in TPJ and behavioral audience effect across individuals. Each dot represents the data of a single participant. Each line represents the linear fit. Shaded areas represent the 95% confidence interval.

