Figure 6.
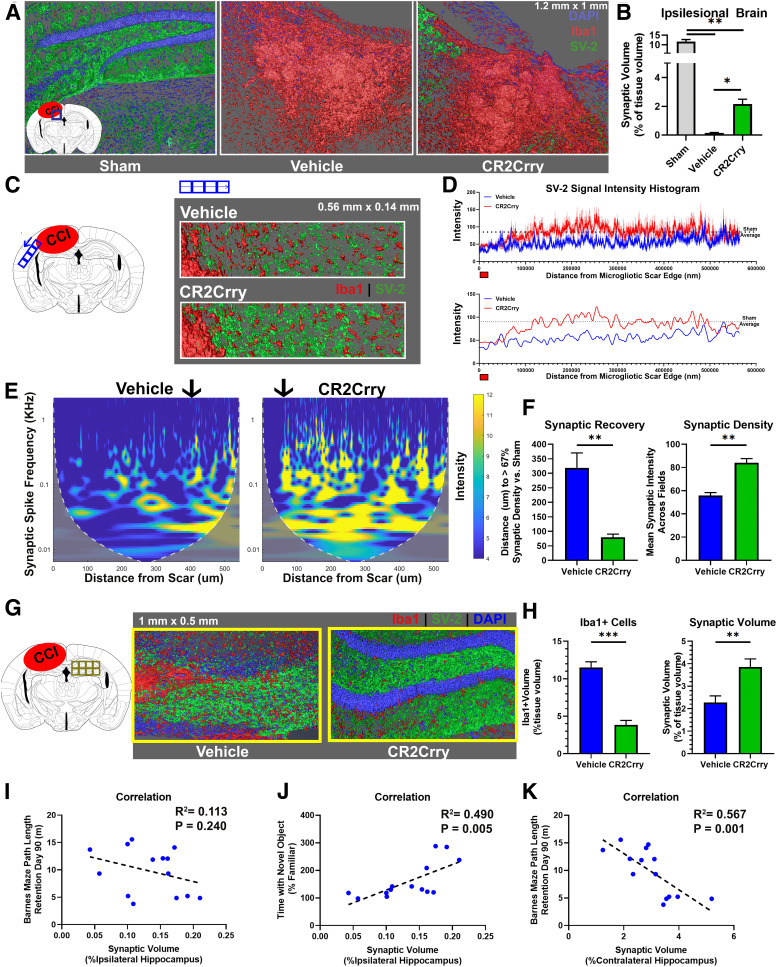
Complement inhibition at 2 months after TBI prevents ongoing synaptic loss. Animals were subjected to TBI at 12 weeks of age, and treated over 1 week with 3 doses of CR2Crry or vehicle every other day starting 2 months after TBI. Analyses were performed at 3 months after TBI. A, Confocal imaging of 1.2 mm × 1 mm × 0.04 mm IF fields from the perilesional brain of sham, or vehicle and CR2-Crry treated mice stained for synaptic bodies (SV-2, green), microglia/macrophages (Iba1, red), and DAPI (blue). Shown are 3D fields reconstructed using Amira from the same stereotactic lesion. Loss of hippocampal architecture is evident in post-TBI brains. B, The total synaptic volume was quantified, using Amira 3D volume reconstruction, as a percentage of synaptic volume per tissue volume. N = 5 animals/group. *p < 0.05; **p < 0.01; Welch's ANOVA test with Dunnett's multiple comparisons. C, Synapse (SV-2, green) and microglia (Iba1, red) staining of sections selected from the perilesional brain starting from the edge of the scar over a 0.5 mm length. Representative images showing 3D stack of 40-μm-thick sections, imaged using confocal microscopy. D, Top, Histogram showing changes in synaptic signal intensity as a function of distance from gliotic scar edge (red marker), from vehicle and CR2-Crry-treated animals. Shown are mean ± SEM per distance data point. N = 5 animals/group. Bottom, Smoothed curve of the change in synaptic density over distance between groups. Dashed line indicates sham density. Curve indicates earlier normalization of synaptic intensity in CR2Crry-treated mice compared with vehicle. E, Magnitude scalogram for data from D, showing the intensity (power) of synaptic signal over distance from gliotic scar in terms of different frequencies of peaks (spikes in histogram denoting individual synapses). Scalograms represent a clearly higher intensity in CR2Crry-treated animals across higher frequencies compared with vehicle. Black arrow indicates distance at which synaptic density recovers 67% intensity compared with that in sham animals. F, Quantification of synaptic recovery measured as the distance to recover 67% of synaptic density, and the overall synaptic density across the two groups. N = 5 animals/group. **p < 0.01 (Student's t test). G, High-resolution 3D reconstruction of the contralateral hippocampus from confocal imaging of SV-2 and Iba1-stained slices at 90 d after TBI. H, Quantification of Iba1 cell density and synaptic volume from vehicle and CR2-Crry-treated mice. N = 5 animals/group. **p < 0.01; ***p < 0.001; Student's t test. I–K, Correlation of ipsilateral synaptic volume with performance on Barnes maze on day 90 (I) and performance on NOR task on day 90 (J). K, Correlation of synaptic volume in contralateral hippocampus with Barnes maze performance. Shown on graph are R2, p value, and N for Pearson's coefficient for linear correlation. Error bars indicate mean ± SEM. Blue circles represent vehicle. Green circles represent CR2Crry.

