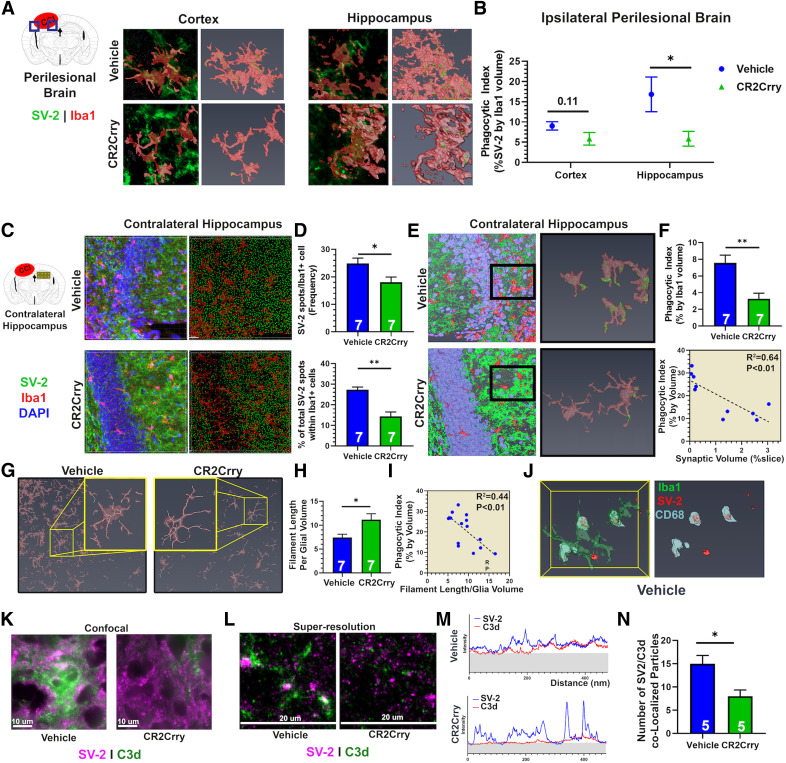
Figure 7.
Complement guides microglial phagocytosis of synapses chronically after TBI. Animals were subjected to TBI at 12 weeks of age, and treated over 1 week with 3 doses of CR2Crry or vehicle every other day starting 2 months after TBI. Analyses were performed at 3 months after TBI. A, Super-resolution IF staining of SV-2 and Iba1 in the perilesional brain showing colocalization of synaptic material to microglial cell bodies. Shown are the 2D snapshots of the Iba1 volume (red) and SV-2 (green) signal (left) and the 3D volume of microglia showing synaptic material within the Iba1 volume (right) from both cortex and hippocampus. B, Quantification of the phagocytic index (volume of SV-2 signal within Iba1 cells to volume of Iba1 cells) from the cortex and hippocampus of both groups. N = 5 animals/group. *p < 0.05 (Student's t test). C, Confocal IF imaging of the contralateral hippocampus stained for SV-2 and Iba1 (left column) followed by automated 3D reconstruction and spot analysis by Imaris representing synapses as spots in 3D space (right column; see Materials and Methods). D, Quantification of synaptic puncta or spots within microglia cells from C. N = 7 animals/group. *p < 0.05; **p < 0.01; Student's t test. E, Representative 3D reconstruction of high-power fields from contralateral hippocampus followed by selection and reconstruction of individual microglia with internalized synaptic material: green represents SV-2; red represents Iba1; blue represents DAPI. Fields are 212 × 212 × 40 μm. F, Quantification of phagocytic index in contralateral hippocampus. N = 7 animals/group. **p < 0.01 (Student's t test). G, Representative high-power fields from the contralateral hippocampus stained for Iba1 followed by filament analysis in Imaris to assess for extent and length of branching per microglia. H, Quantification of the length of microglial branching in G, normalized to the microglial volume. N = 7 animals/group. *p < 0.05 (Student's t test). I, Correlation of length of microglial branching and phagocytic index. Pearson's correlation, R2 = 0.44, p < 0.01. J, IF staining for Iba1 (red), CD68 (yellow), and SV-2 (green) followed by reconstruction of individual microglia in Amira showing colocalization of CD68 and SV-2 signal. Clusters of CD68-SV-2 colocalization were observed in vehicle controls and not in CR2Crry-treated mice. K, L, Confocal and super-resolution imaging of SV-2 and C3d colocalization using Vutara 352 super-resolution microscopy. M, Quantification of intensity histogram for both SV-2 and C3d signals. Shaded region represents background signal. N, Quantification of colocalization of peaks in M between the two experimental groups. N = 5 animals/group. **p < 0.05 (Student's t test). Error bars indicate mean ± SEM.

