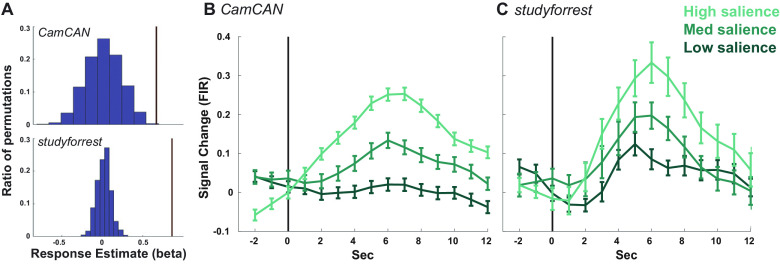
Figure 1.
Hippocampal response to event boundaries. A, The average amplitude of the canonical response to an event boundary (brown lines) relative to the distribution of responses when randomly shuffling event order. Shown for Cam-CAN (top) and studyforrest (bottom). B, C, Average response, across participants, to event boundaries, binned by boundary salience, in Cam-CAN (B) and studyforrest (C). The per-participant time course was calculated using an FIR, and error bars reflect the SEM at each time point. The vertical black line represents the event boundary.

