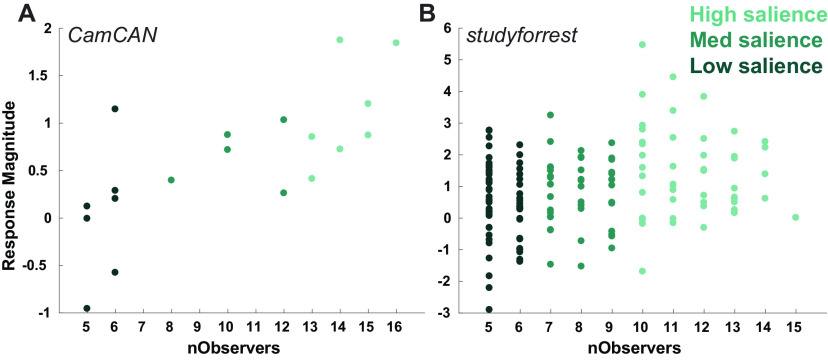
Figure 2.
Sensitivity of hippocampal response 909 to boundary salience. The average magnitude of the canonical response to event boundaries (averaged over participants), by the number of observers that marked them (nObservers). Each dot represents the average response to a single boundary, while its color reflects its salience level. A, B, Results are presented for Cam-CAN (A) and studyforrest (B).

