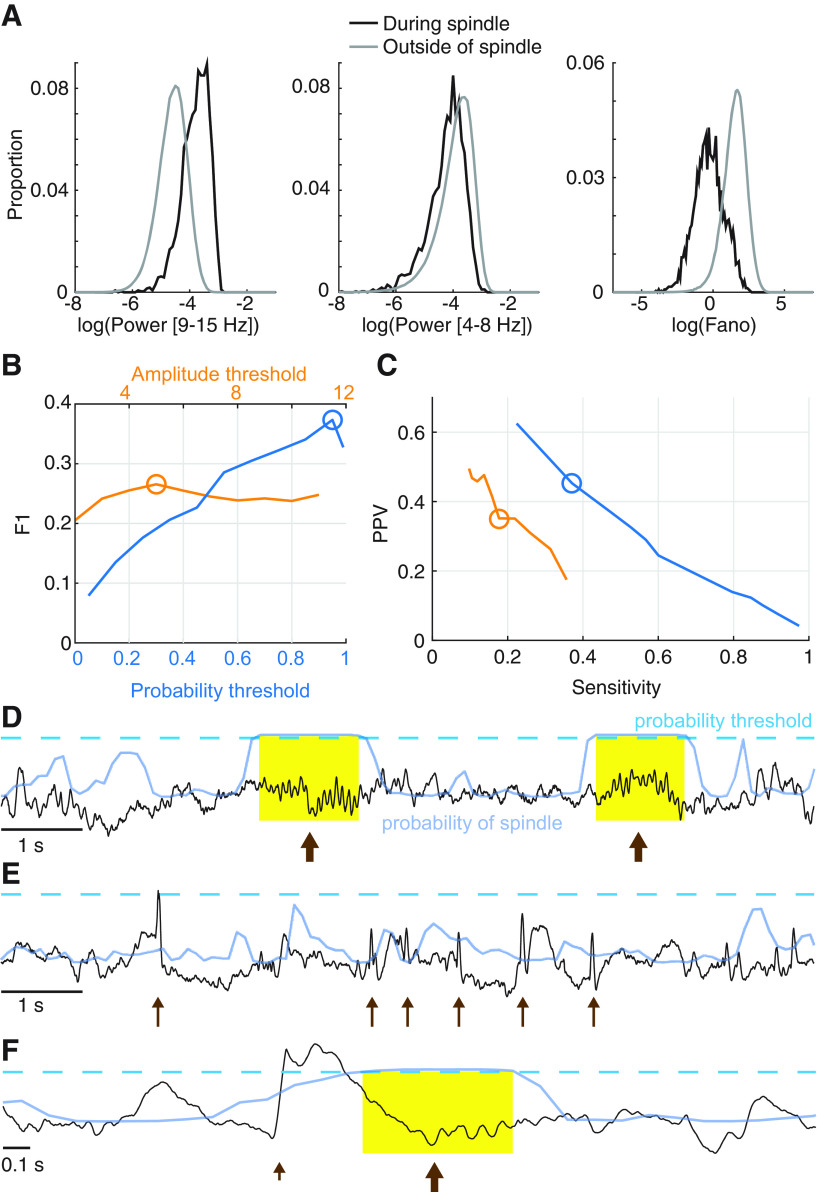
Figure 2.
The LS detector outperforms an existing method in the context of epilepsy. A, Distributions of the three features used by the LS detector, calculated for the training data. B, C, Comparison of the LS detector (blue) and an existing spindle detection method (orange). The LS detector performs with higher (B) F1, (C) sensitivity, and PPV than an existing spindle detector. D–F, Illustration of the LS detector (blue curves) applied to example EEG (black) as in Figure 1. When the LS detector exceeds the threshold (dashed line), a spindle is detected. Yellow represents example detections. Spindles (D,F) are accurately detected (arrows). Abrupt increases in the EEG because of epileptiform spikes (E, thin arrows) or a K-complex (F, short arrow) are not detected as spindles.

