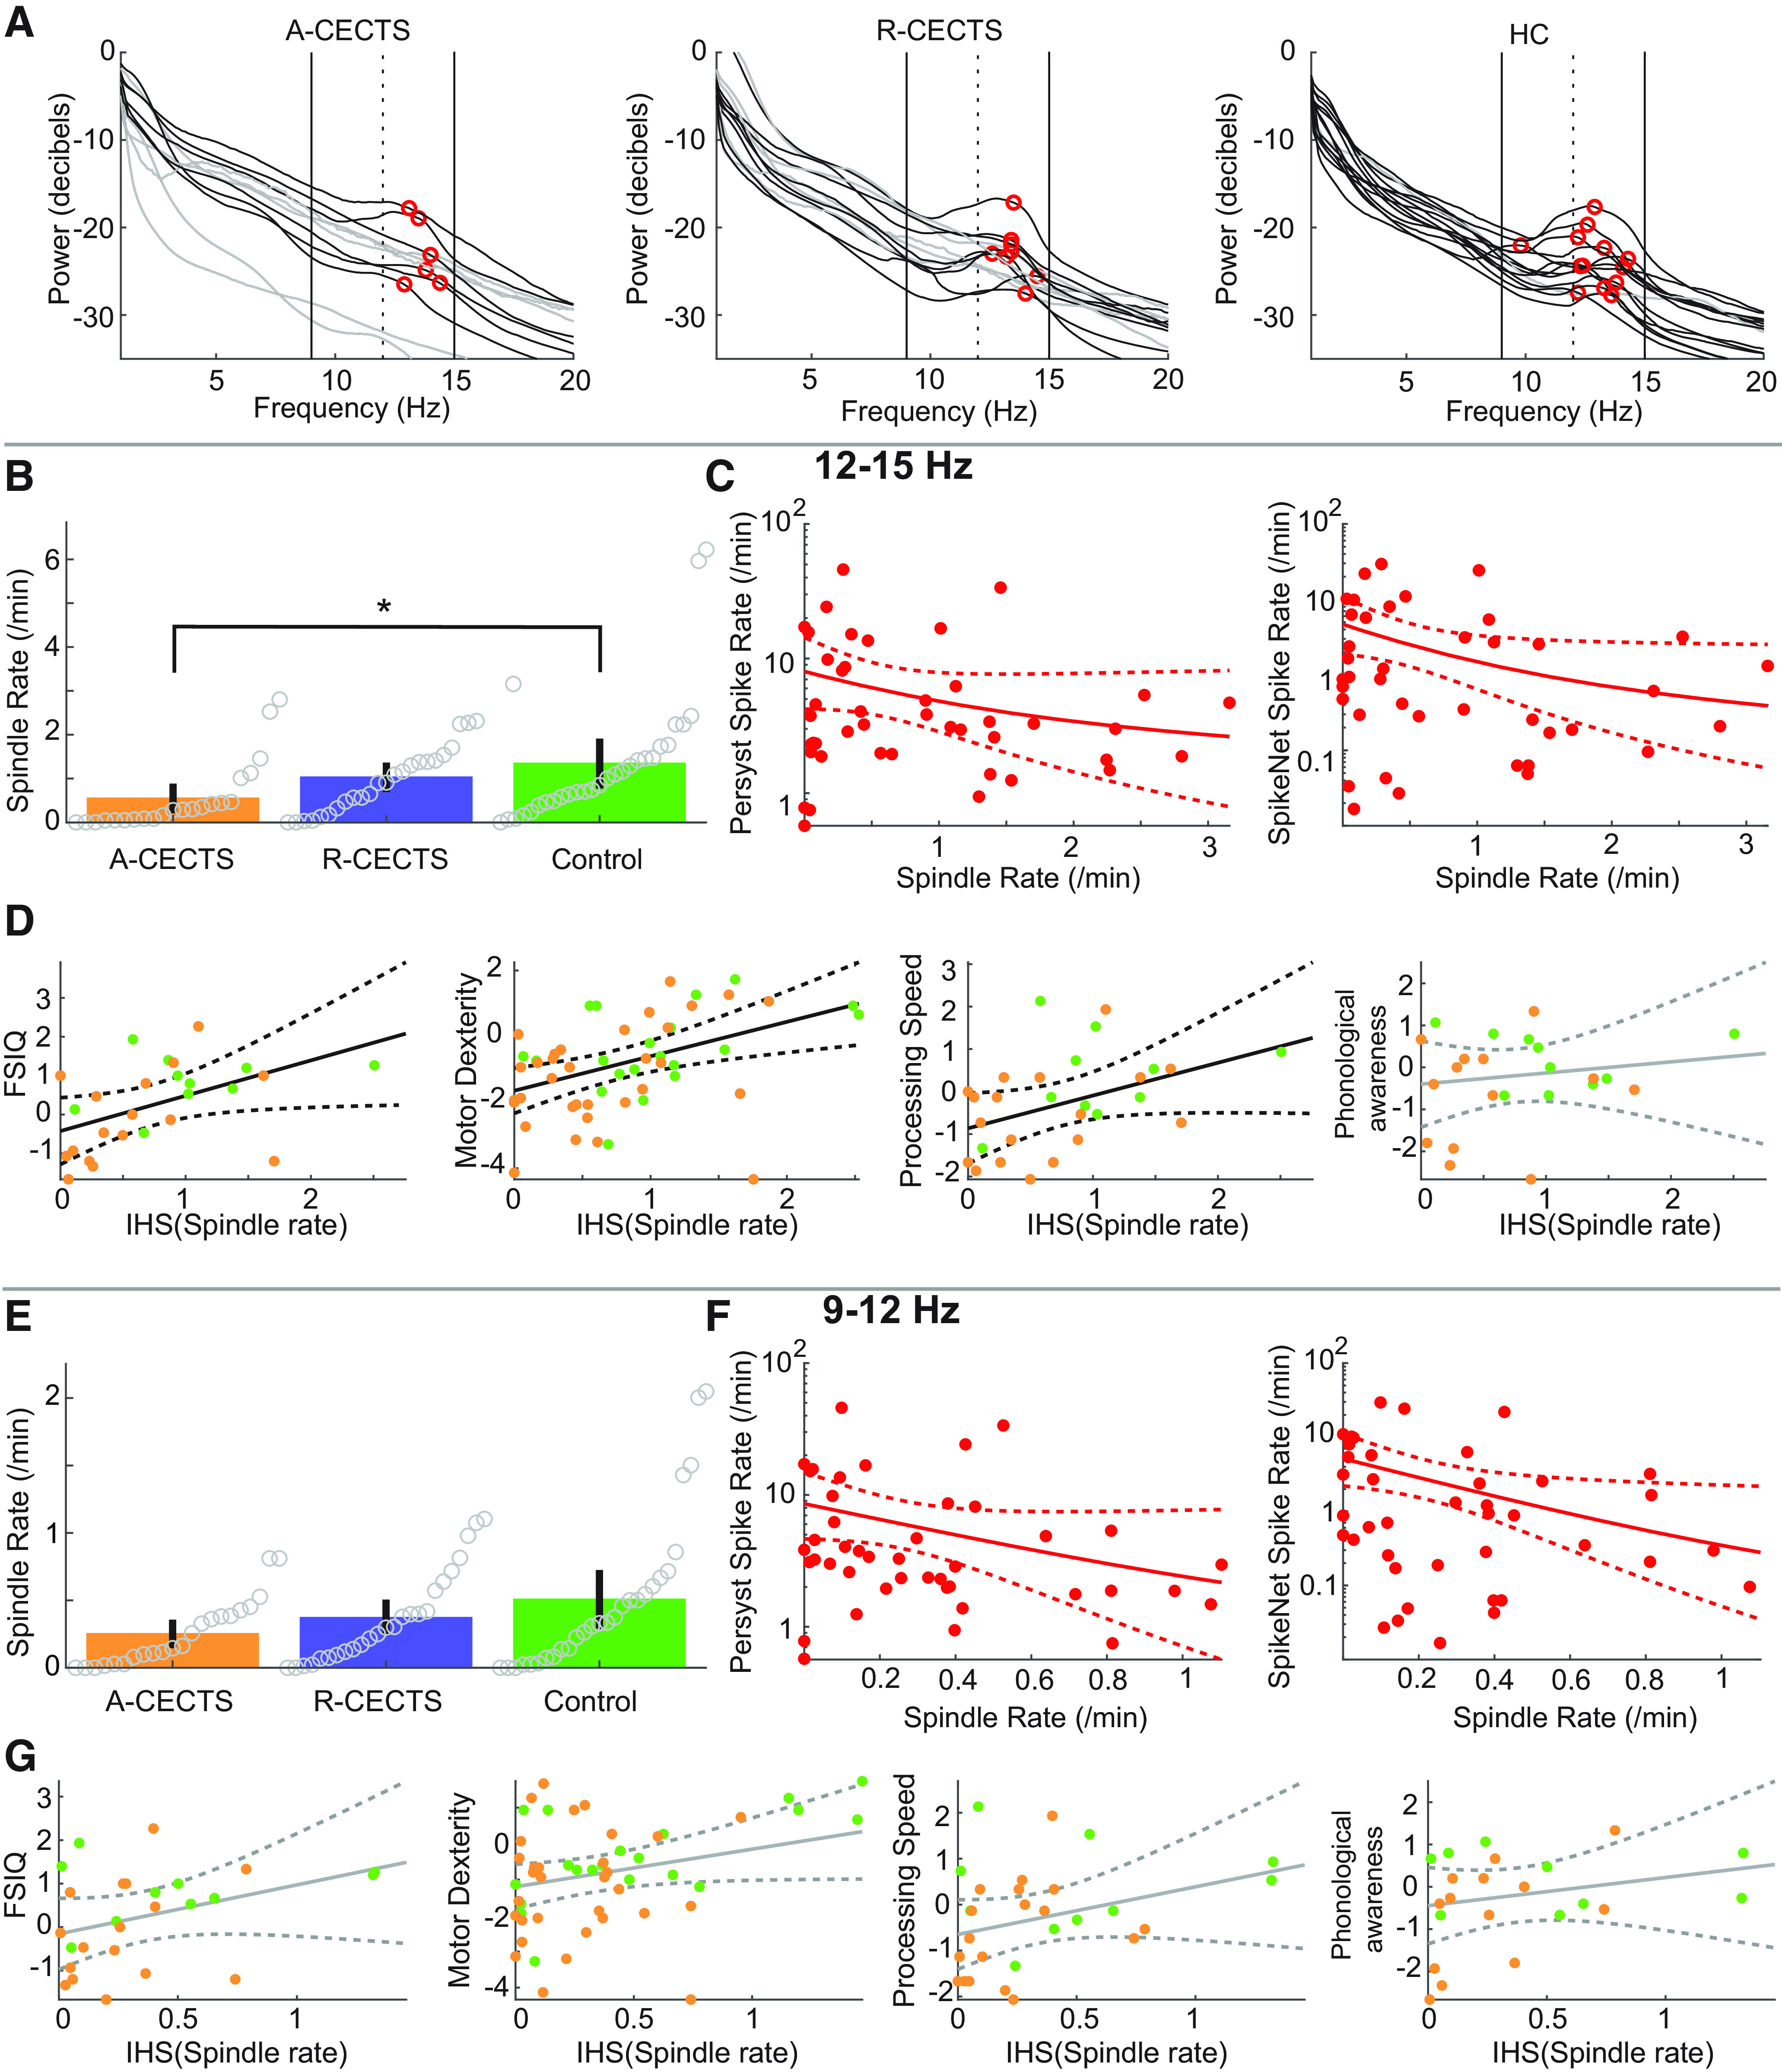
Figure 9.

Analysis of fast spindles reveals consistent results. A, Power spectra for each subject, in each group. For most subjects, peak power in the σ band (red circles) occurs at a frequency >12 Hz (vertical dashed line). In each figure, black (gray) curves indicate subjects with (without) a local maximum in the σ band (9-15 Hz, vertical black lines). B–G, Results of narrowband analysis for (B–D) 12-15 Hz and (E–G) 9-12 Hz. B, E, Spindle rate per group (see Fig. 3). C, F, Spindle rate versus spike rate (see Fig. 5). D, G, Spindle rate versus neuropsychological score (see Fig. 6). *p = 0.034.
