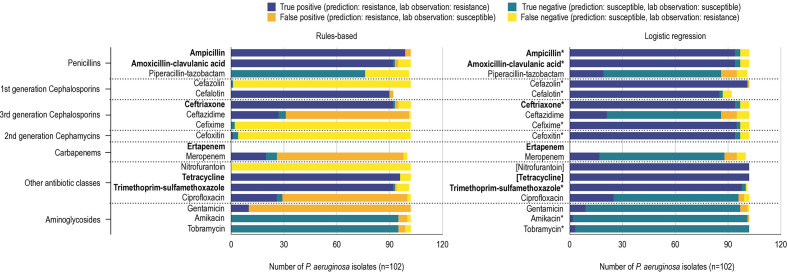
Fig. 2.
True-positive, true-negative, false-positive and false-negative predictions of P. aeruginosa resistance phenotype using a rules-based (left) and logistic regression (right) method. Antibiotic susceptibility tests used 17 antibiotics (ertapenem was not tested in P. aeruginosa ) organized into their respective drug classes. Prediction performances for antibiotic logistic regression classifiers using RGI detected AMR determinants to predict resistance phenotypes for E. coli and P. aeruginosa . True positives (dark blue) and true negatives (teal) indicate that the classifier predicted resistance and susceptibility correctly. False positives (orange) indicates classifier prediction of resistant but an AST of susceptible. Similarly, false negatives (yellow) indicates classifier prediction of susceptible but an AST of resistant. The rules-based method uses RGI, EPI and the Antibiotic Resistance Ontology to predict resistance phenotypes. Logistic regression classifiers use RGI-detected AMR determinants to predict resistance phenotypes. Logistic regression models for antibiotics for which <10 % of a species’ isolates displayed susceptible or resistant phenotypes could not be properly validated and tested and as such were trained using all the data (indicated by an asterisk). Similarly, when all isolates were resistant or susceptible a ‘dummy’ model was used, which always returns the relevant label (placed in square brackets). The bolded antibiotics represent antibiotics that P. aeruginosa confer intrinsic resistance towards, according to the Clinical and Laboratory Standards Institute (CLSI). The total of P. aeruginosa phenotype predictions does not always equal the total number of isolates (n=102) because not all isolates were tested against every antibiotic.

