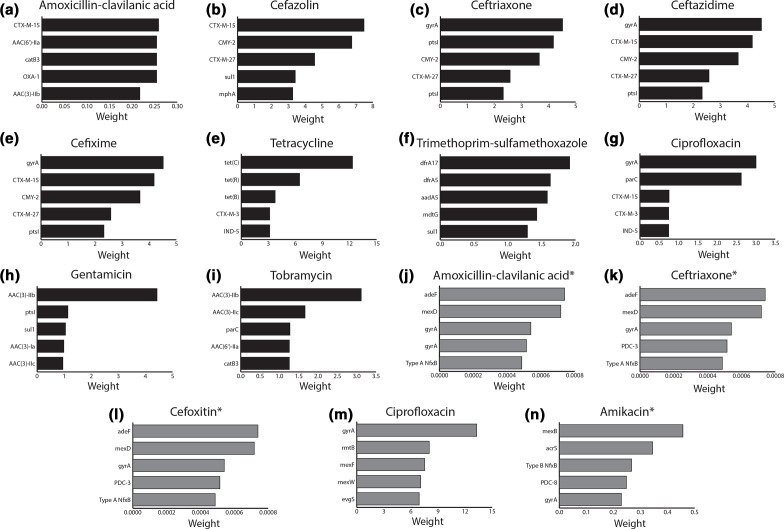
Fig. 3.
Logistic regression and RGI identify resistance determinants for predicting E. coli and P. aeruginosa resistance phenotypes that are supported by the literature. The x-axes indicate assigned logistic regression weights for individual AMR phenotype predictions, while the y-axes list the top five weighted AMR determinants. Black and grey bars represent E. coli and P. aeruginosa resistance phenotypes, respectively. An asterisk indicates that <10 % of a species’ isolates displayed a susceptible or resistant phenotype to amikacin and therefore could not be properly validated and tested, so were trained using all of the data. Models identifying resistance determinants inconsistent with the literature are shown in Figs S4 and S5.

