
Fig. 7. Investigation of the role of SAMD1 during ES cell differentiation.
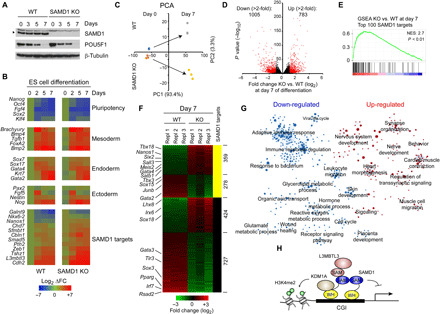
(A) Western blot of SAMD1 and POU5F1 during undirected ES cell differentiation by LIF removal. (B) RT-qPCR experiments of stem cell and differentiation markers, as well as SAMD1 target genes during the differentiation. Three biological replicates were performed. (C) PCA analysis of RNA-seq data at days 0 and 7 of ES cell differentiation. Three biological replicates were performed. (D) Volcano plot of RNA-seq data after 7 days of differentiation in WT and SAMD1 KO cells. In red are genes that are significant (P < 0.01) and at least twofold differentially expressed. (E) GSEA of top 100 SAMD1 target genes, comparing SAMD1 KO versus WT cells at day 7 of the differentiation. (F) Genes from (D) shown has heatmap and sorted for SAMD1-bound and unbound genes. (G) GSEA followed by network analysis, demonstrating up- and down-regulated pathways in SAMD1 KO cells after 7 days of differentiation. The circle radius indicates the size of the gene sets. (H) Model of putative SAMD1 function at CGIs.