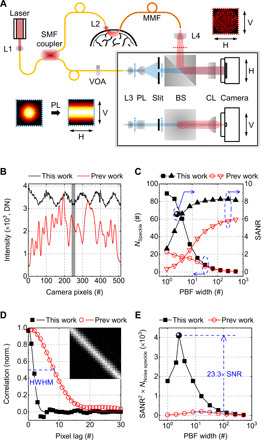
Fig. 2. fiDWS for optical BFI in the human brain.

(A) Schematic of fiDWS. The interferometer detection path is shown in both horizontal (H) and vertical (V) views. Transverse intensity distributions of sample and reference light, at positions indicated by red and blue dotted lines, are shown (insets) with correspondingly colored dotted frames. SMF, single-mode fiber; MMF, multimode fiber; L1 to L4, lenses; VOA, variable fiber-optic attenuator; PL, Powell lens; BS, beamsplitter; CL, cylindrical lens. (B) Intensity patterns of reference light used in this work (black) and previous work (45) (red). DN, digital number. (C) Comparisons of estimated NSpeckle (squares and circles) and SANR (triangles) versus width of rectangular window used for pixel binning. Corresponding SANR (for this work), based on optimized pixel binning (fig. S5), is indicated by the spherical symbol. Blue dashed ovals with arrows point to corresponding y axes. (D) Spatial correlation of heterodyne signals across pixels (scatters) and corresponding Gaussian fits (solid curves). Inset shows the correlation matrix of the current system within the gray shaded region in (B). HWHM, half width at half maximum. (E) Comparison of SANR2 × NNoise speckle, a metric for fiDWS system performance that is proportional to the autocorrelation SNR. The spherical symbol shows the fiDWS results with optimized data processing (see also section S6 and fig. S5), achieving a ~23.3 times improvement compared to (45). Note that comparisons in (C) to (E) are based on phantom measurements with the same S-C separation.
