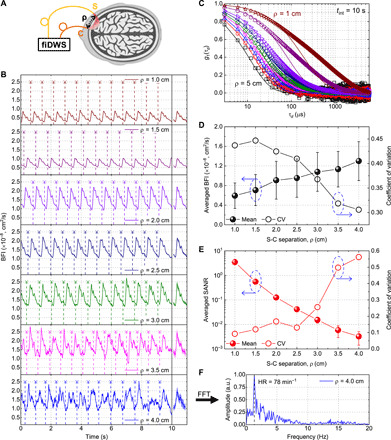
Fig. 3. fiDWS monitors pulsatile BFI at 3.5-cm S-C separation and autocorrelations at up to 5-cm S-C separation from the adult human forehead.

(A) Schematic of human brain measurements. (B) Pulsatile BFI traces from a single subject with S-C separations from 1 to 4 cm. Temporal sampling and integration time are 0.01 and 0.1 s, respectively. Vertical dashes show estimated boundaries of BFI pulses corresponding to heartbeats. The heartbeat-averaged BFI waveforms [standard deviations (SDs) shaded] follow the BFI traces. (C) Normalized field autocorrelations [g1(τd)] at multiple S-C separations from 1 to 5 cm for the same subject in (B) (open symbols), with an integration time of 10 s. Solid curves show semi-infinite DCS model fits. (D and E) Averaged BFI (D) and SANR (E) versus S-C separation from multiple forehead locations across multiple subjects. Error bars indicate SDs. Corresponding coefficients of variation (CV; right y axes) are shown for averaged BFI (D) and SANR (E). Blue dashed ovals around symbols with arrows point to corresponding y axes. (F) Fast Fourier transform (FFT) spectrum of pulsatile BFI trace at 4-cm S-C separation (B) shows a peak (dashed line) at the HR of 78 min−1. a.u., arbitrary units.
