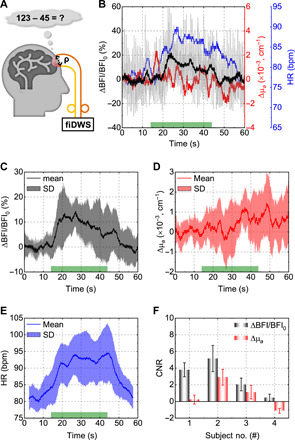
Fig. 6. fiDWS during prefrontal cortex activation.

(A) Schematic of MA experiments. (B) Single trial changes in BFI with a 0.1-s integration time (light gray), BFI with a 2-s integration time (black), absorption (red), and HR (blue), the latter estimated from a short-time FFT of pulsatile BFI within a 5-s sliding window. The green bar on the x axis indicates the stimulus duration. (C to E) Averaged BFI (C), absorption (D), and HR (E) responses from multiple MA trials for one subject. Shading indicates SDs across trials. (F) The contrast-to-noise ratio (CNR) of BFI exceeds that of absorption for four subjects. Error bars indicate standard errors across trials. All BFIs in this figure were estimated by the SL-DCS model, with no absorption compensation.
