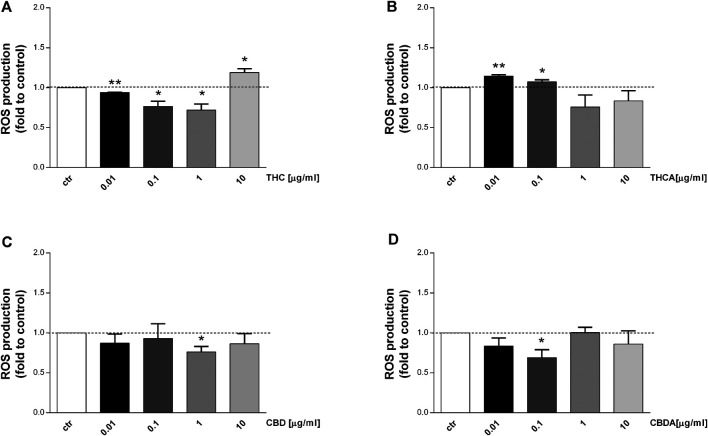
FIGURE 4.
Effect of a 24 h treatment with THC (A), THCA (B) CBD (C), CBDA (D) (0.01-0.1-1-10 μg/mL), on Caco-2 ROS production in basal condition. Data are expressed as mean ± SEM of fluorescence intensity (FI) of treated cells related to control. n = 3 experiments. *p < 0.05, **p < 0.01, ***p < 0.001 treatment vs. control, Standard ANOVA procedures.

