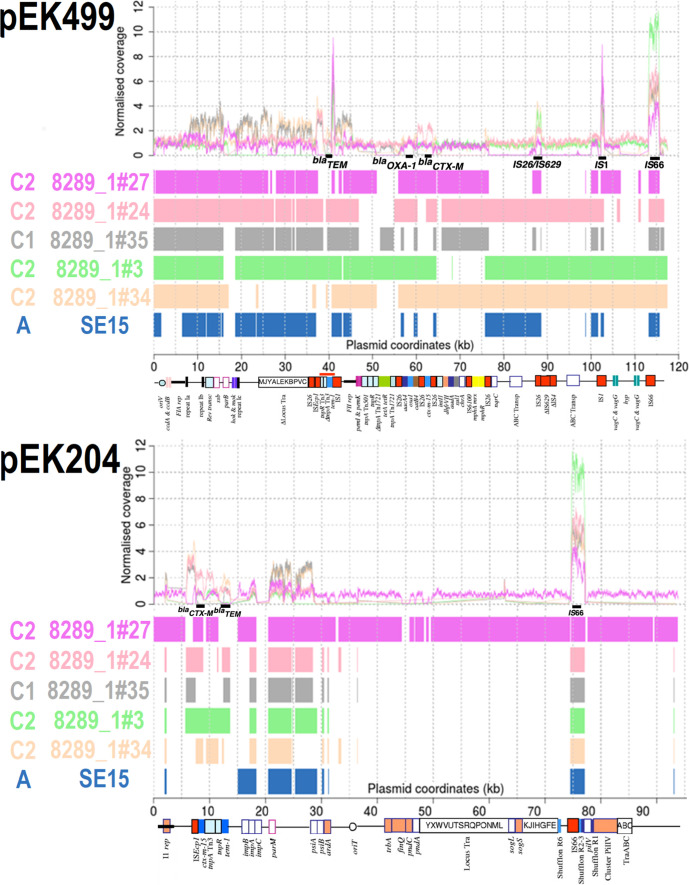
Fig. 2.
Comparison of pEK499 (top, 117 536 bp) and pEK204 (bottom, 93 732 bp) with five ST131 C1 and C2 isolates, ST131 Clade A reference SE15 (navy) and two HMP assemblies (3_2_53FAA in dark green and 83 972 in cyan). Top: Normalised read coverage showed high copy numbers of IS1 (at 41 and 103 Kb of pEK499) and IS66 (at 75–77 Kb of pEK204, and at 113 Kb of pEK499). Bottom: blast alignments showed limited similarity for the HMP assemblies and SE15 relative to higher levels for Clade C for pEK499 : 8289_1#27 (C2, mauve), 8289_1#24 (C2, pink), 8289_1#35 (C1, grey), 8289_1#3 (C2, light green), 8289_1#34 (C2, beige). For pEK204, only 8289_1#27 had many regions of similarity. Genes encoding bla TEM, bla OXA-1 and bla CTX-M-15 are at 40, 58 and 63 Kb on pEK499 (respectively). The bla CTX-M gene was at 8 Kb, bla TEM was at 13 Kb, followed by mixed conjugation and segregation genes at 36–70 Kb on pEK204. For pEK204, the bla CTX-M-3 gene differs from bla CTX-M-15 by a single R240G substitution, and so bla CTX-M genes detected here were bla CTX-M-15. The annotation was modified from [59]. Matches spanning >300 bp are shown.

