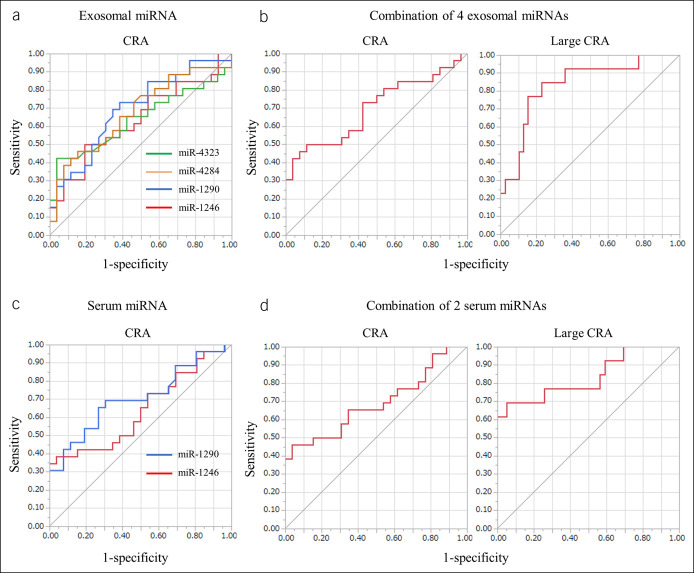
Figure 4.
ROC curve analysis using serum or exosomal miRNA levels to distinguish between patients with CRA. (a) Exosomal miR-4323, miR-4284, miR-1290, and miR-1246 levels yield respective AUC values of 0.637, 0.677, 0.694, and 0.667 in distinguishing between patients with CRA. (b) Combined usage of 4 serum exosomal miRNAs gives AUC values of 0.698 in distinguishing CRA (left) and 0.834 in distinguishing large CRA (approximately ≥12.6 cm2) (right). (c) Serum miR-1290 and miR-1246 levels yield AUC values of 0.705 and 0.639, respectively. (d) Combined usage of 2 serum miRNAs results in an AUC value of 0.691 for CRA (left) and 0.834 for large CRA (right). AUC, area under the curve; blue line, miR-1290; CRA, colorectal adenoma; green line, miR-4323; miRNA, microRNA; red line, miR-1246; ROC, receiver operating characteristic; yellow line, miR-4284.

