. 2021 Apr 19;10:e61769. doi: 10.7554/eLife.61769

Figure 3. Netrin 1 (NTN1) and deleted in colorectal carcinoma (DCC) regulate midline zipper glia (MZG) morphology and spatial distribution.

Nestin-positive radial glia (white; A, C, E) and Glast-positive glia (white; B, D, F, K) in embryonic day (E)14–E16 Dcckanga mice (A–F) and E15 Ntn1-LacZ mice (K) demonstrate the distribution of glial processes along the interhemispheric fissure (IHF) surface (yellow brackets) and lateral to the IHF (white arrowheads) with insets (C’, B’, D’, F’). Radial fibres of the glial wedge (GW) are indicated with magenta arrowheads. The mean fluorescence intensity of Glast staining between wildtype and Dcckanga mice at E14 (G), E15 (H) and E16 (I) based on the results from (B), (D) and (F), respectively. (J) The ratio of glial distribution over total midline length, with schema, based on the results from (A) to (F). All graphs represent mean ± SEM. Statistics by Mann–Whitney test . n.s: not significant; *p<0.05, **p<0.01. See related Figure 3—figure supplement 1 and Supplementary file 1.

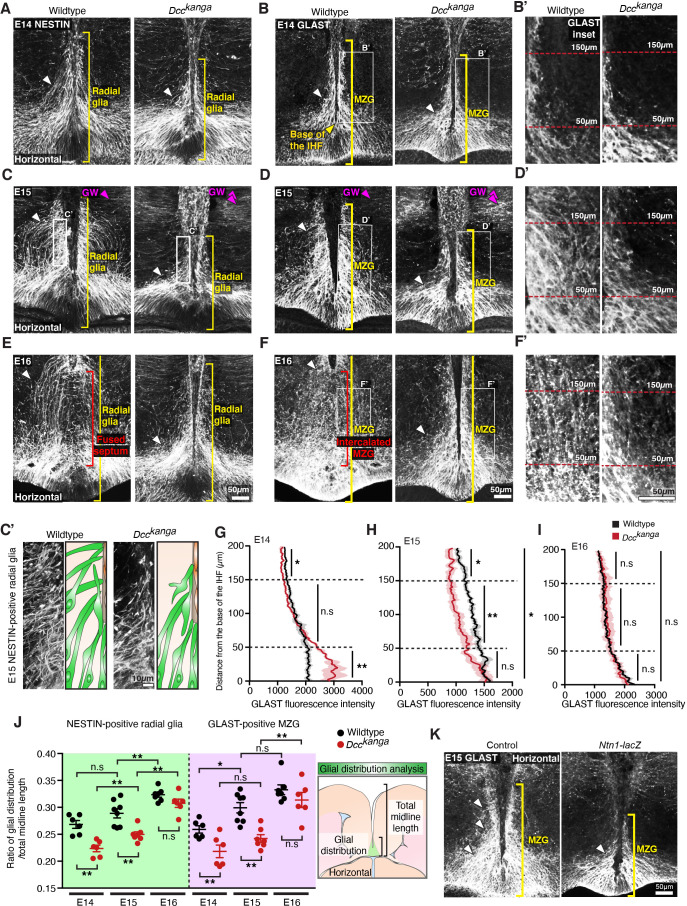
Figure 3—source data 1. Fluorescence intensity of GLAST and ratio of glial distribution/total midline length in Dcc mouse mutants.
elife-61769-fig3-data1.xlsx (124.2KB, xlsx)

Figure 3.

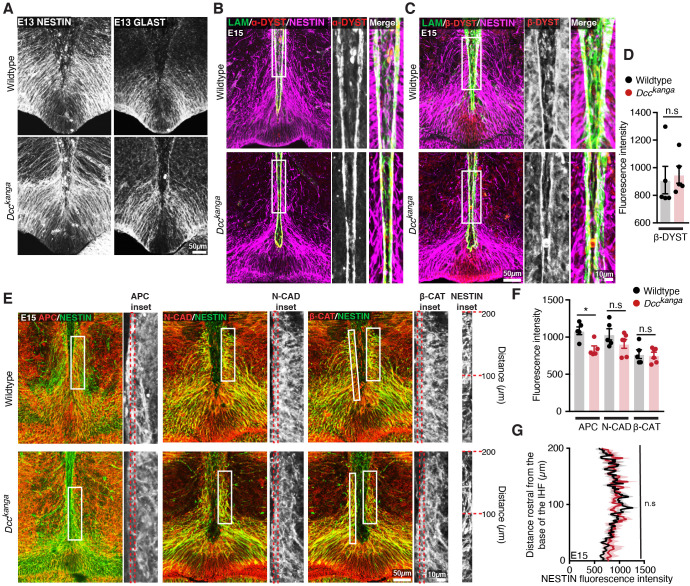
Figure 3—figure supplement 1. Deleted in colorectal carcinoma (DCC) is not required for endfeet attachment or molecular polarity of midline zipper glia (MZG).

Figure 3—figure supplement 1.

(A) Nestin-positive radial glia (white) and Glast-positive MZG (white) in horizontal sections of embryonic day (E)13 wildtype and Dcckanga mice. (B, C) Pan-Laminin (LAM)-positive leptomeninges and basement membrane (green), Nestin-positive radial glia (magenta) and α-dystroglycan (α-DYST; red; B) or β-dystroglycan (β-DYST; red, C) in horizontal sections of E15 wildtype and Dcckanga mice. (D) Quantification of fluorescence intensity of β-DYST along 200 µm of the interhemispheric fissure (IHF) surface as outlined with red dotted box in (C). (E) Nestin-positive radial glia (green) with either adenomatous polyposis coli (APC, red), N-cadherin (N-CAD; red) or β-catenin (β-CAT; red) in horizontal sections of E15 wildtype and Dcckanga mice with insets. (F) Quantification of the fluorescence intensity of APC, N-CAD and β-CAT within 5 µm of the IHF as outlined in red dotted-edged boxes from (E). (G) Quantification of the fluorescence intensity of Nestin-positive radial glial endfeet within 5 µm of the IHF surface from inset in (E). All graphs represent mean ± SEM. Statistics by Mann–Whitney test. n.s: not significant, *p<0.05. See related Supplementary file 1.
Figure 3—figure supplement 1—source data 1. Fluorescence intensity of β-dystroglycan (β-DYST), β-catenin (β-CAT), adenomatous polyposis coli (APC) and N-cadherin (N-CAD) along the interhemispheric fissure (IHF) surface in Dcckanga mice.