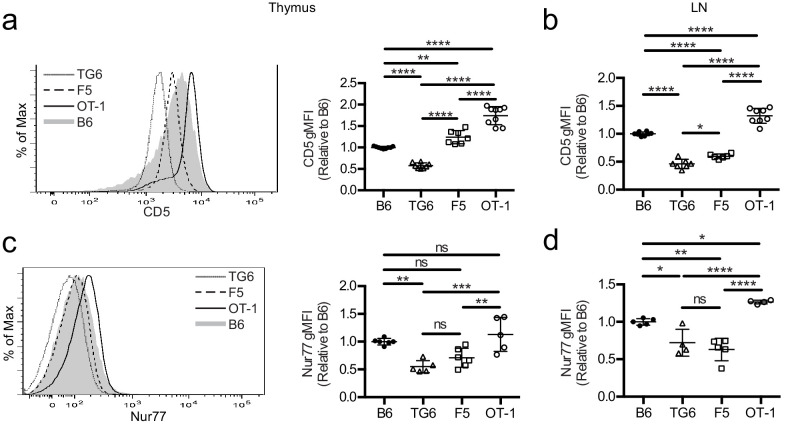
Figure 1. TG6, F5, and OT-1 CD8SP cells express CD5 and Nur77 across the polyclonal spectrum.
CD8SP cells were harvested from the thymus and lymph nodes of wild-type (B6), TG6, F5, and OT-1 TCRtg mice and analyzed by flow cytometry. (a, b) Representative (left) and quantified by geometric mean fluorescence intensity (right) CD5 surface expression on (a) CD8SP thymocytes and (b) CD8SP lymph node cells. (c, d) Representative (left) and quantified (right) intracellular Nurr77 expression gated on (c) CD8SP thymocytes and (d) CD8SP lymph node cells. Data are presented as average ± SD and analyzed using an ordinary one-way ANOVA followed by a Tukey’s multiple comparisons (*p<0.05, **p<0.01, ***p<0.001, ****p<0.0001). All data are compiled from three or more experiments.


