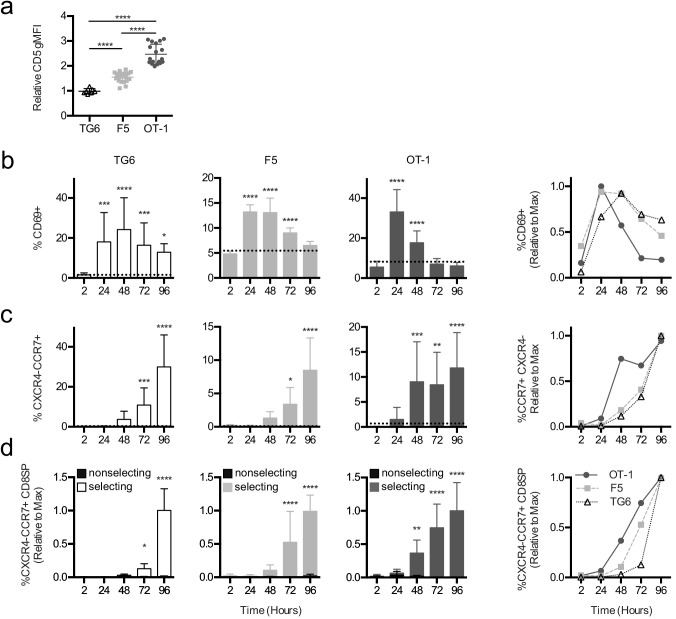
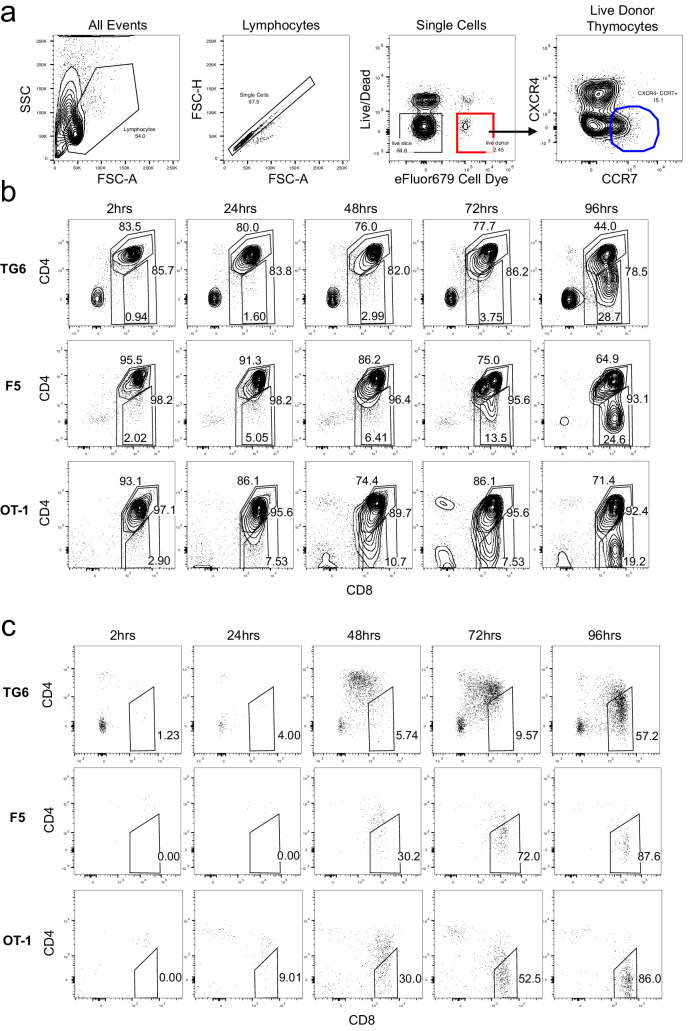
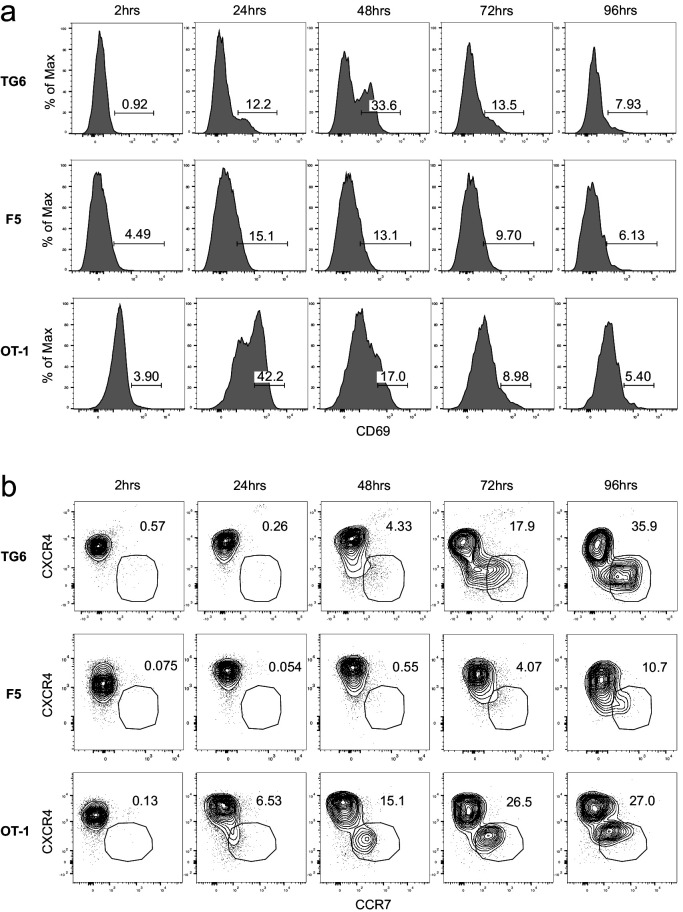
Figure 3. Thymocytes with lower self-reactivity exhibit delayed in situ positive selection kinetics relative to those with high self-reactivity.
(a) Expression of CD5 on CXCR4−CCR7 + CD4 CD8+TG6 (96 hr), F5 (72 hr and 96 hr), and OT-1 (72 hr and 96 hr) donor cells developed in thymic slices. Values for each experiment are normalized to the average CD5 expression of the CXCR4−CCR7 + CD4 CD8+polyclonal slice resident (SR) population at the same time points. (b–d) Preselection TG6 (white bars, triangle), F5 (gray bars, square), or OT-1 (dark grey bars, circle) thymocytes were overlaid onto selecting or nonselecting thymic slices, harvested at 2, 24, 48, 72, or 96 hr post-thymocyte overlay, and analyzed using flow cytometry. Left three graphs show individual values for each transgenic. Horizontal lines in (a) and (b) indicate the average value for nonselecting slices. Right line graph shows the average for all three transgenics overlaid. (b) Percent of CD69+ cells within the CD4+CD8+ and CD4−CD8+populations. (c) Percentage of CXCR4−CCR7 + cells within CD4+CD8+ and CD4−CD8+populations. (d) Percentage of CXCR4−CCR7 + CD4 CD8+ cells out of the donor population. Values for each experiment are normalized to the average at the time point with the maximum CD8SP development (72 hr or 96 hr). For (a), data are presented as average ± SD and analyzed using an ordinary one-way ANOVA with Tukey’s multiple comparisons (****p<0.000). For (b–d), data are presented as average ± SD and analyzed using an ordinary one-way ANOVA with Dunnett’s multiple comparisons (**p<0.01, ***p<0.001, and ****p<0.0001) comparing to 2 hr time point. All data are compiled from three or more experiments. Preselection thymocyte populations were obtained from TG6tg Rag2−/− H2b mice, irradiated β2M−/− mice reconstituted with F5tg Rag1−/− bone marrow, and OT-1tg Rag2−/− β2M−/− mice. See also Figure 3—figure supplements 1 and 2.


