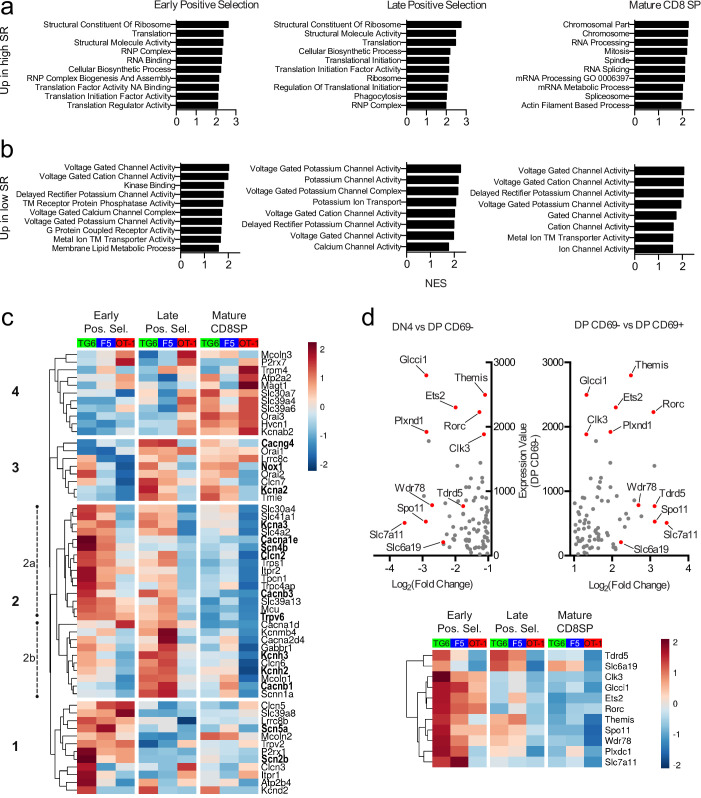
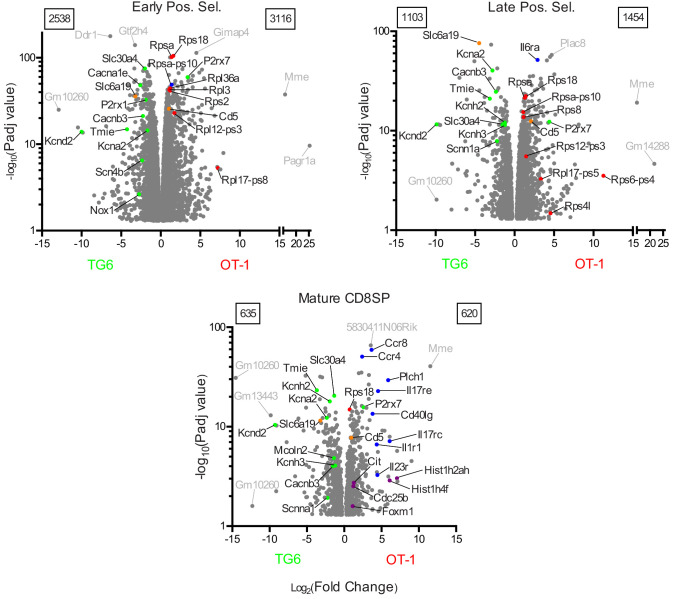
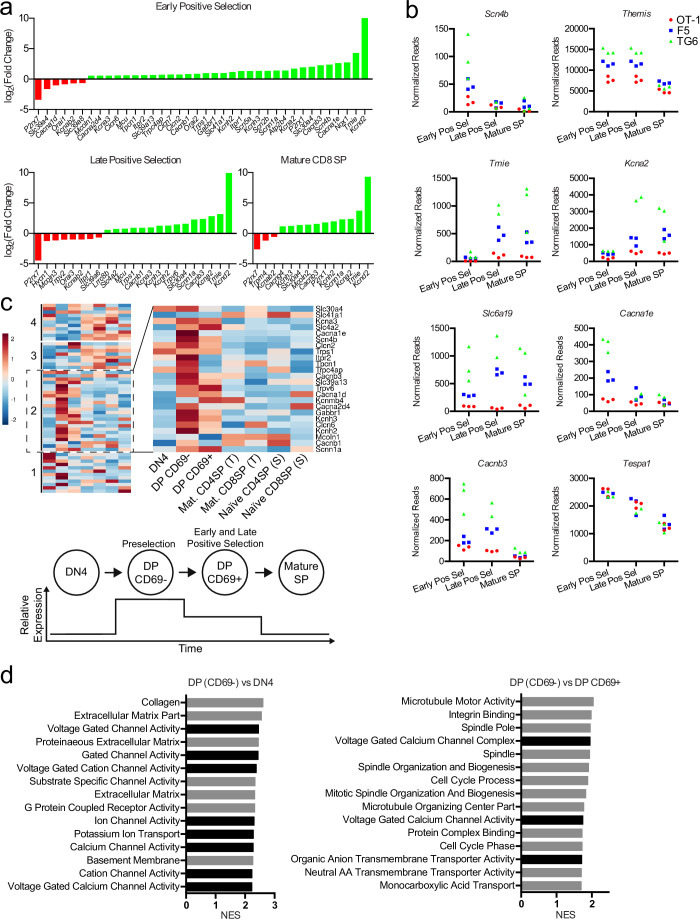
Figure 6. Thymocytes with low self-reactivity retain a preselection gene expression program marked by elevated expression of ion channel genes.
RNA-seq of OT-1, F5, and TG6 thymocytes at the early positive selection, late positive selection, and mature CD8SP stages. All samples have three biological replicates except for TG6 late positive selection, which has two biological replicates. (a, b) Gene set enrichment analysis (GSEA) was performed on all pairwise combinations of TCRtg samples, and the gene sets were filtered for enrichment in the order of self-reactivity (OT-1>F5>TG6) (a) or in the inverse order of self-reactivity (TG6>F5>OT-1) (b). Normalized enrichment scores (NES) are from the OT-1 vs TG6 (a) or TG6 vs OT-1 (b) comparison. Abbreviations: self-reactive (SR), ribonucleoprotein (RNP), nucleic acid (NA), transmembrane (TM). (c) Heatmap of differentially expressed (padj<0.05 for OT-1 vs TG6 comparison) ion channel genes (see Materials and methods) across all three stages and all three transgenic models. Gene expression values normalized by the DESeq2 variance stabilizing transformation were averaged over biological replicates and scaled per row. Heatmap is hierarchically clustered into four groups, numbered in the order of expression during development. Leading-edge genes from GSEA are in bold. (d) (Top) Plot of expression level in DP CD69− thymocytes versus fold difference for DN4 versus DP CD69− (left side of X-axis) or DP CD69− versus DP CD69+ (right side of X-axis) for ImmGen microarray data. The 11 genes chosen to represent the ‘preselection DP’ gene signature are indicated with red dots. (Bottom) Heatmap of normalized expression (as in (c)) of the 11 representative preselection DP genes in TG6, F5, and OT-1 thymocytes at the indicated stage of development.


