
Author response image 1. Average speed of nonsignaling (nonsig) timepoints in tracks with at least one signaling event.
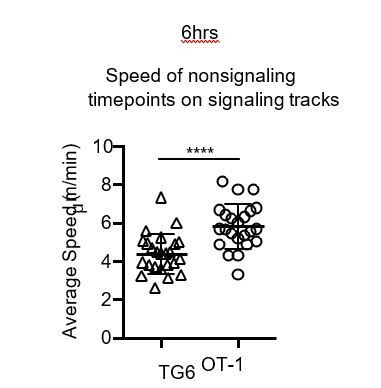
Each dot represents a single track. Data are presented as average ± SD and analyzed using a Student’s T-test (****P<0.0001). All data are compiled from two or more experiments.