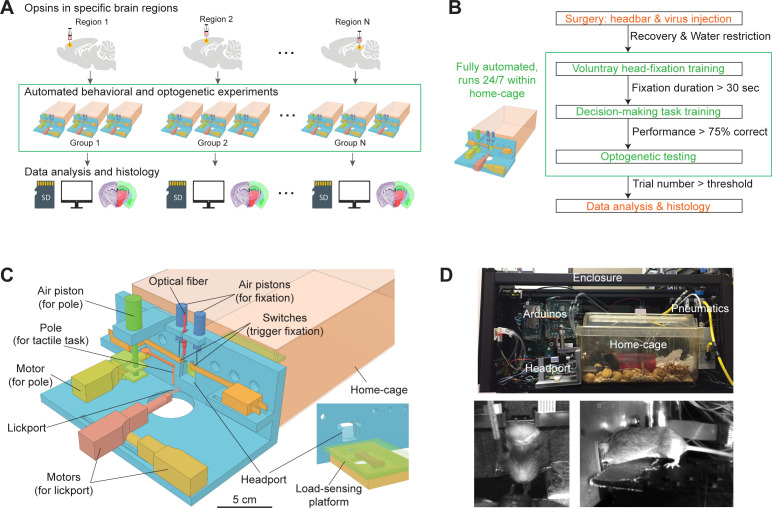
Figure 1. Workflow for autonomous behavior and optogenetic experiments and design of home-cage system.
(A) Workflow for autonomous behavioral and optogenetic experiments. In each group of mice, optogenetic opsins are expressed in a specific brain region. Naive mice undergo autonomous behavioral training and optogenetic testing in their home-cage. Multiple groups of mice are tested in parallel to examine multiple brain regions. Data is stored on SD cards for analysis. Histology is performed at the end of the workflow to register the targeted brain regions to an atlas. Green bounding box highlights the portion of the workflow that is unsupervised by experimenters. (B) Workflow for automated behavioral training and optogenetic testing. After recovery from surgery, mice are housed in the home-cage system 24/7. Automated computer algorithms train mice to perform voluntary head-fixation, decision-making task, and carry out optogenetic testing. The progression in the workflow is based on behavioral performance. Green bounding box corresponds to the bounding box in (A). (C) Design of the home-cage system. The main component is a behavioral test chamber which can be accessed through a headport from the home-cage. Inset shows the view of the headport from inside the home-cage. Mice access the headport on a load-sensing platform. See Figure 1—figure supplement 1 and Materialsand methods for details. (D) Photographs of the home-cage system. Top: side view of the system. The system is standalone with controllers (Arduinos) and actuators packed into a self-contained enclosure. Bottom, the front and back view of a mouse accessing the headport and performing the tactile decision task.


