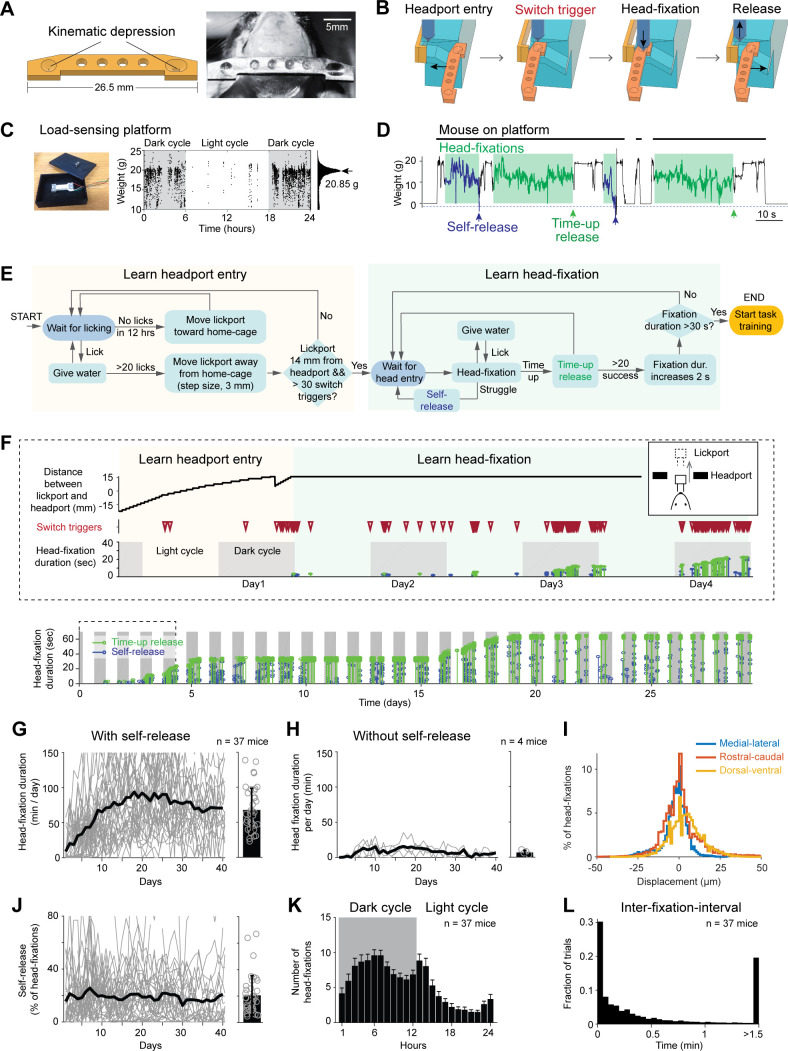
Figure 2. Voluntary head-fixation in home-cage.
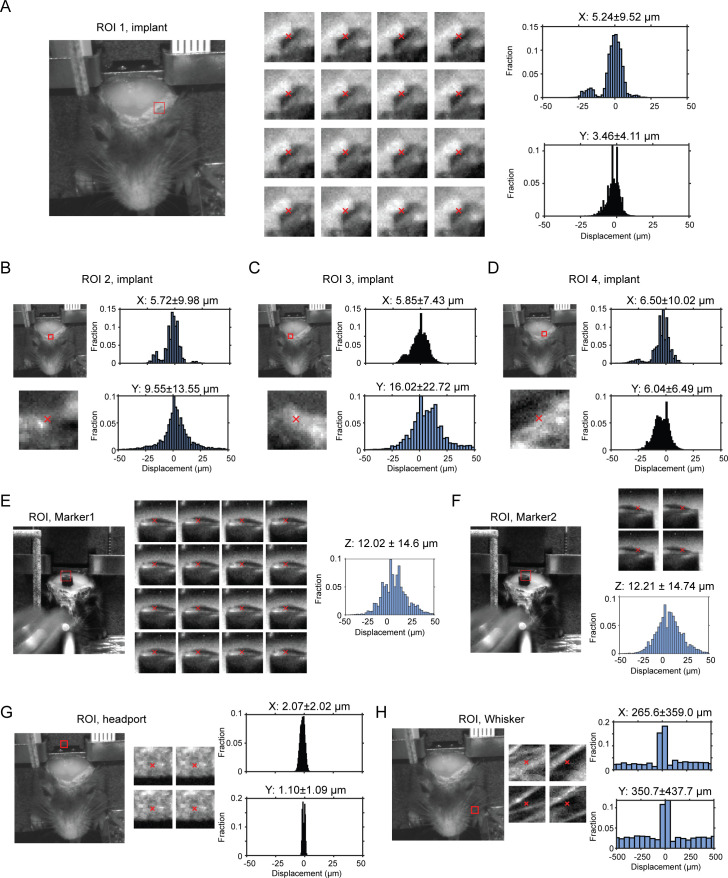
(A) Left, schematic drawing of the custom headbar. Right, photograph of a headbar implant. (B) Schematic drawings of a head-fixation and release sequence. Headbar enters a widened track on both sides of the headport that guides the headbar into a narrow spacing at the end. Two mechanical switches located on either side of the headport trigger pneumatic pistons to clamp the headbar. Head-fixations are released by retracting the pneumatic pistons. (C) Left, photograph of the load-sensing platform with top plate removed and load cell exposed. Right, example readings from the load cell (20 samples/s) in a 24-hr period. Shaded areas, dark cycles. Absence of samples indicates the mouse is off the platform. The histogram shows all readings from the 24-hr period. The peak can be used to estimate the mouse’s body weight. (D) Example readings from the load cell during four consecutive head-fixations (green shades). Head-fixations typically reduce weight on the platform. Readings crossing a threshold (blue dashed line) result in self-release (blue arrows). Otherwise, the mouse is released after a predefined fixation duration (time-up release, green arrows). Fixation duration is 30 s in this example. (E) Flow chart of the head-fixation training protocol. See Materials and methods for details. (F) Data from an example mouse undergoing head-fixation training. Top, data from the first 4 days. The plots show lickport position (top, large value indicates further away from the home-cage, see inset), switch trigger events (middle), and head-fixation events (bottom). For head-fixation events, each tick indicates one fixation, with the height indicating fixation duration. The color indicates time-up release (green) and self-release (blue). Shaded areas, dark cycles. Time spent in learning headport entry and learning head-fixation are colored as in (E). Bottom: head-fixation data from the same mouse over 29 days. (G) Head-fixation duration over 40 days. Gray lines, individual mice; black line, mean. Bar plot shows average fixation duration throughout the entire head-fixation training. Error bar, standard deviation. Circles, individual mice. (H) Same as (G) but for mice without the self-release mechanism. (I) Displacement of the headbar implant across different head-fixations along medial-lateral, rostral-caudal, and dorsal-ventral directions. (J) Fraction of head-fixations in which mice trigger self-release. Gray line, individual mice; black line, mean. Bar plot shows average fraction throughout the entire head-fixation training. Error bar, standard deviation. Circles, individual mice. (K) Frequency of head-fixation across dark and light cycles. Bars show average across all mice. Error bars, standard deviations. (L) Time interval between head-fixations. Data from all mice are pooled.


