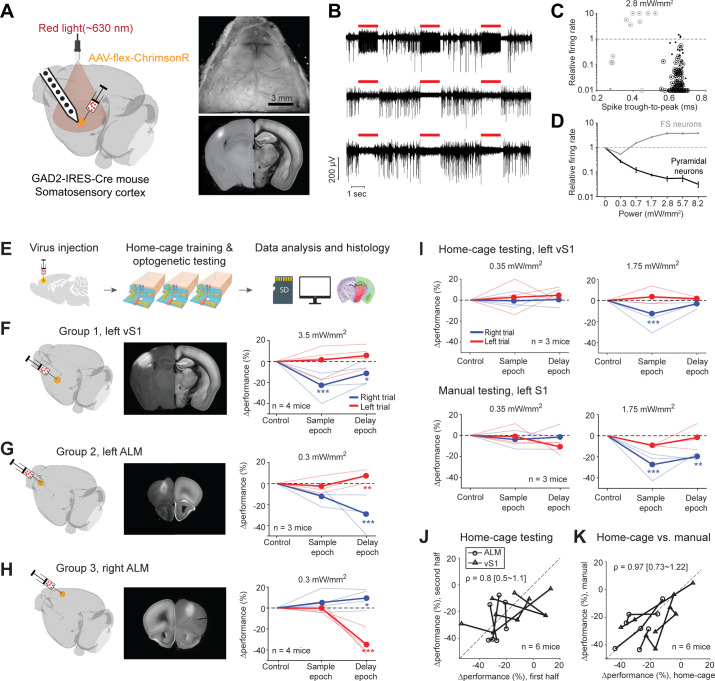
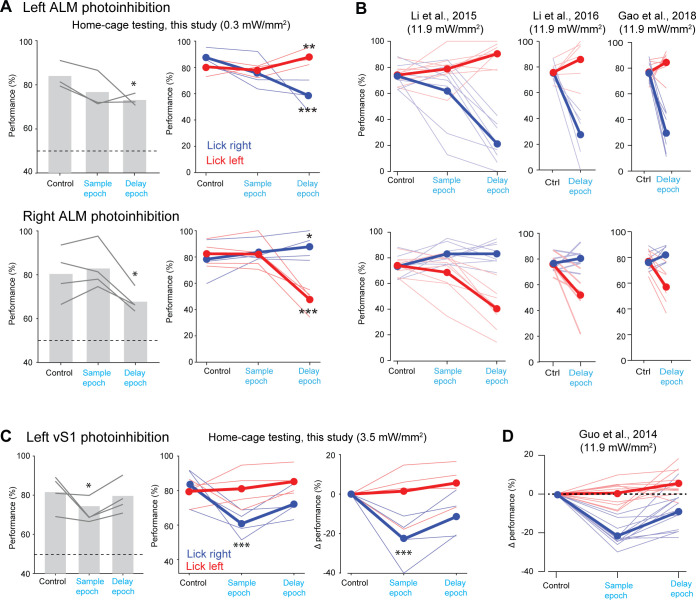
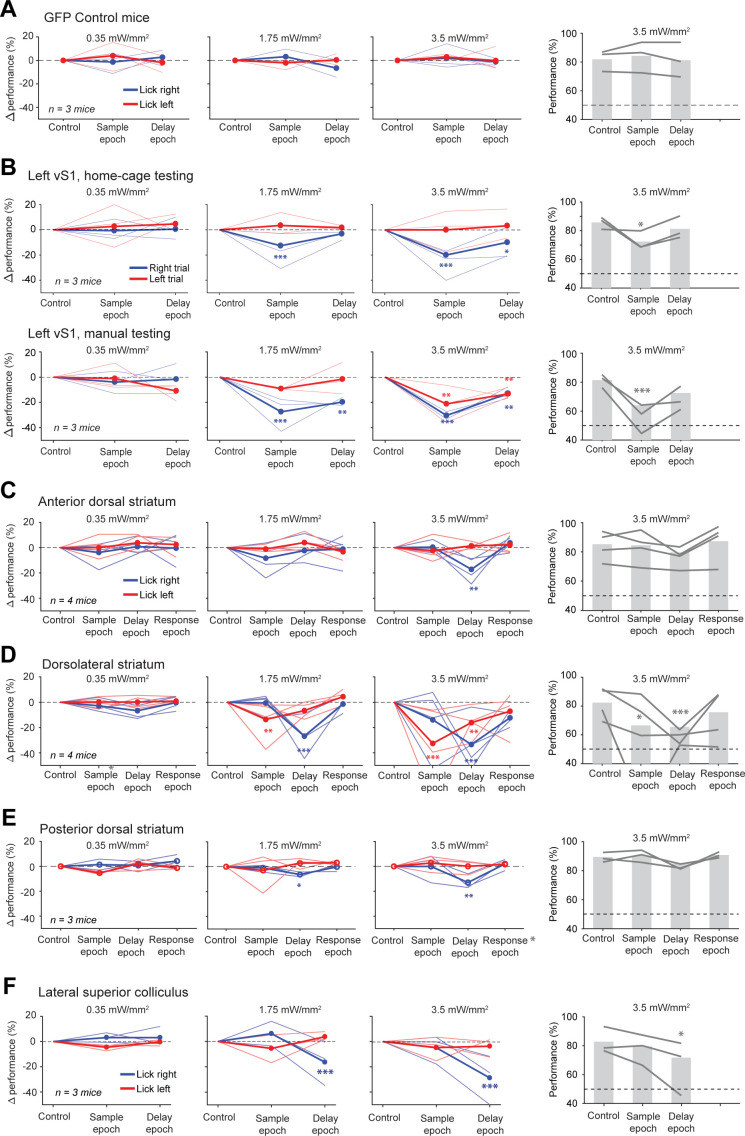
Figure 7. Photoinhibition of cortical regions and comparisons of home-cage optogenetic experiments with manual optogenetic experiments.
(A) Left, an optogenetic approach to silence activity in specific brain regions and electrophysiology characterization in the barrel cortex (vS1). Right top, an example clear skull implant. Right bottom, a coronal section showing ChrimsonR expression in vS1. The coronal section is aligned to the Allen Refence Brain (Materials and methods). (B) Silicon probe recording in vS1 during photostimulation. Multi-unit activity from three example channels showing photoexcitation (first row) and photoinhibition (second and third rows). Red lines, photostimulation. (C) Effects of photostimulation on cell types defined by spike waveform. Dots, individual neurons. Circled dots, neurons with significant spike rate change, p<0.05, two-tailed t-test. Spike rate of each neuron during photostimulation is normalized to its baseline (‘relative firing rate’, Materials and methods). Neurons with narrow spike waveforms are putative fast-spiking (FS) interneurons (gray). Neurons with wide spike waveforms are putative pyramidal neurons (black). (D) Relative firing rate of putative pyramidal neurons (black) and interneurons (gray) as a function of photostimulation intensity. Error bars show SEM across neurons. (E) Workflow schematics. (F) Photoinhibition of the left vS1. Left, a 3D rendered brain showing virus injection location. Middle, a coronal section showing virus expression in the left vS1. Right, behavioral performance change relative to the control trials during photoinhibition in the sample and delay epoch. Performance for lick left (red) and lick right trials (blue) are computed separately. Thin lines, individual mice; thick lines, mean. *p<0.025; **p<0.01; ***p<0.001, significant performance change compared to the control trials (bootstrap, Materials and methods). (G) Same as (F) but for photoinhibition of the left ALM. (H) Same as (F) but for photoinhibition of the right ALM. (I) Behavioral performance change relative to the control trials during photoinhibition in home-cage optogenetic experiments (top row) and manual optogenetic experiments (bottom row). See the full dose response in Figure 7—figure supplement 2. (J) Comparison of performance change during the first vs. second half of optogenetic testing. Data from all mice and experiments (left vS1 photoinhibition, three mice; left ALM photoinhibition, one mouse; right ALM photoinhibition, two mice). Lines connect data from multiple photostimulation intensities for individual mice. For each brain region, only the condition in which photoinhibition induced the largest behavioral effect is included. Left vS1, data from the lick right trials, sample epoch photoinhibition. Left ALM, data from the lick right trials, delay epoch photoinhibition. Right ALM, data from the lick left trials, delay epoch photoinhibition. Linear regression, slope: 0.8; range: 0.5–1.1 (95% confidential interval). There is no difference between the first and second half of the home-cage optogenetic experiments (p=0.78, paired t-test). Home-cage optogenetic experiments span 12 ± 4.5 days, mean ± SD. (K) Comparison of performance change in home-cage versus manual optogenetic experiments. Linear regression, slope: 0.97; range: 0.73–1.22 (95% confidential interval). There is no difference between home-cage and manual experiments (p=0.36, paired t-test).


