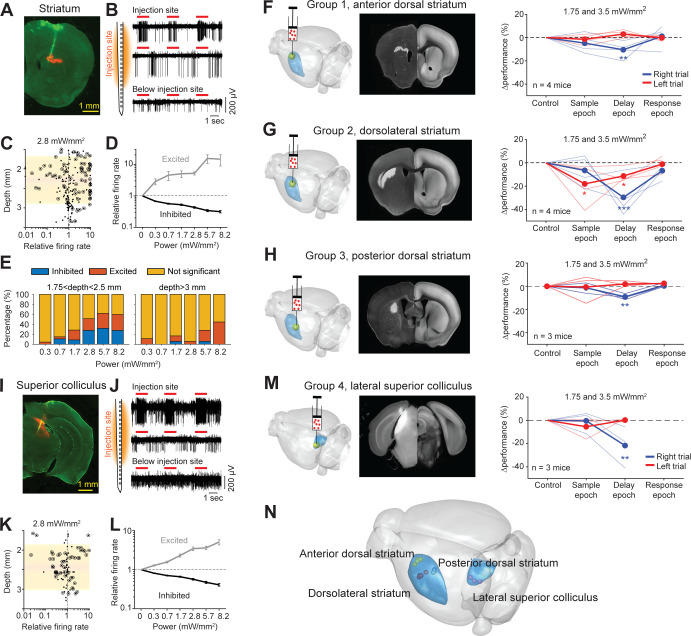
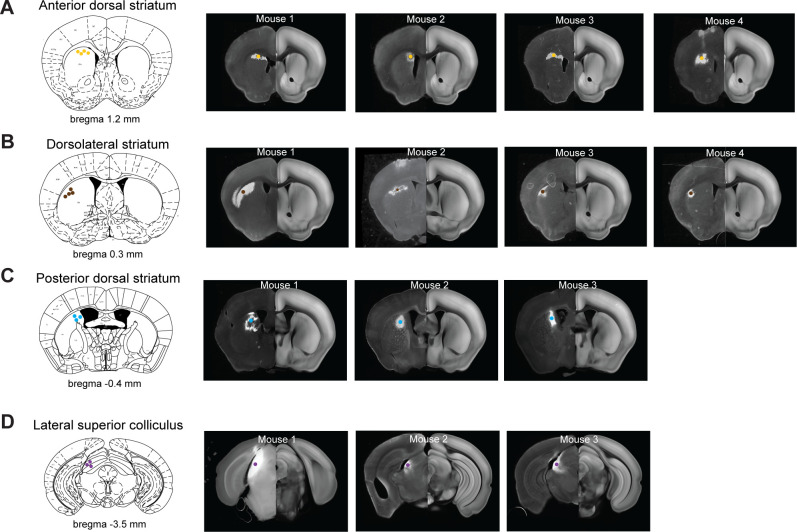
Figure 8. Photostimulation of subcortical regions in home-cage optogenetic experiment.
(A) A coronal section showing virus expression in the striatum (red) and silicon probe recording track (green). (B) Silicon probe recording in the striatum during photostimulation. Multi-unit activity from two example channels near the virus injection site (top) and one example channel below the injection site. Red lines, photostimulation. (C) Effects of photostimulation across depths. Dots correspond to individual neurons. Circled dots indicate neurons with significant spike rate change, p<0.05, two-tailed t-test. Spike rate of each neuron during photostimulation is normalized to its baseline (‘relative firing rate’, Materials and methods). Shaded area indicates the virus expression region estimated from histology. (D) Relative firing rate of all significantly excited and inhibited neurons as a function of photostimulation intensity. Error bars show SEM across neurons. (E) Fraction of neurons significantly excited (red) and inhibited (blue) by photostimulation, p<0.05, two-tailed t-test. Left, neurons from near the virus injection site. Right, neurons from below the virus injection site. (F) Left, a 3D rendered brain showing the striatum (blue) and the injection location in the anterior dorsal striatum (yellow). Middle, a coronal section showing example virus expression. The coronal section is aligned to the Allen Reference Brain (Materials and methods). Right, behavioral performance change relative to the control trials during photostimulation in the sample, delay, or response epoch. Blue, lick left trials; red, lick right trials. Thin lines, individual mice; thick lines, mean. **p<0.01, ***p<0.001, significant performance change compared to the control trials (bootstrap, Materials and methods). (G) Same as (F) but for photostimulation in the dorsolateral striatum. (H) Same as (F) but for photostimulation in the posterior dorsal striatum. (I–L) Same as (A–D) but for photoinhibition in the left superior colliculus. (M) Same as (E) but for photoinhibition in the left superior colliculus. (N) The 3D rendered brain shows the striatum and superior colliculus (blue) and the centers of virus expression in individual mice used in this study (dots). See individual mouse data in Figure 8—figure supplement 1.


