Figure 2. FPA-dependent poly(A) site selection.
Loss of FPA function is associated with the preferential selection of distal poly(A) sites, whereas FPA overexpression leads to the preferential selection of proximal poly(A) sites. (A) Illumina RNA-Seq, Helicos DRS and Nanopore DRS reveal FPA-dependent RNA 3′ end processing changes at the FPA (AT2G43410) locus. The 35S::FPA:YFP construct has alternative transgene-derived untranslated regions, so mRNAs derived from the transgene do not align to the native FPA 5′UTR and 3′UTR. (B) Histograms showing change in mean RNA 3′ end position for significantly alternatively polyadenylated loci (EMD >25, FDR < 0.05) in fpa-8 (left panel) and 35S::FPA:YFP (right panel) compared with Col-0, as detected using Nanopore DRS. Orange and green shaded regions indicate sites with negative and positive RNA 3′ end position changes, respectively. (C) Effect size of significant proximal (orange) and distal (green) alternative polyadenylation events in fpa-8 (left panel) and 35S::FPA:YFP (right panel) compared with Col-0, as measured using the EMD. (D) Histograms showing change in mean RNA 3′ end position for significantly alternatively polyadenylated loci (EMD >25, FDR < 0.05) in fpa-8 (left panel) and 35S::FPA:YFP (right panel) compared with Col-0, as detected using Nanopore DRS. Orange and green shaded regions indicate sites with negative and positive RNA 3′ end position changes, respectively. (E) Effect size of significant proximal (orange) and distal (green) alternative polyadenylation events in fpa-8 (left panel) and 35S::FPA:YFP (right panel) compared with Col-0, as measured using the EMD. (F) Boxplots showing the effect size (absolute log2 fold change (logFC)) of alternatively processed loci identified using Illumina RNA-Seq in fpa-8 (left panel) and 35S::FPA:YFP (right panel) respectively. Down- and upregulated loci are shown in orange and green, respectively. For each locus, the region with the largest logFC was selected to represent the locus. Loci with both up- and downregulated regions contribute to both boxes. (G) Boxplots showing the effect size (absolute logFC) of loci with alternative splice junction usage identified using Illumina RNA-Seq in fpa-8 (left panel) and 35S::FPA:YFP (right panel), respectively. Down- and upregulated loci are shown in orange and green, respectively. For each locus, the junction with the largest logFC was selected to represent the locus. Loci with both up- and downregulated junctions contribute to both boxes.

Figure 2—figure supplement 1. Nanopore and Helicos DRS reveal FPA-dependent RNA 3′ end processing changes.

Figure 2—figure supplement 2. Splicing alterations in fpa-8 can be explained by changes in RNA 3′ end formation.

Figure 2—figure supplement 3. FPA does not affect global mRNA m6A methylation.
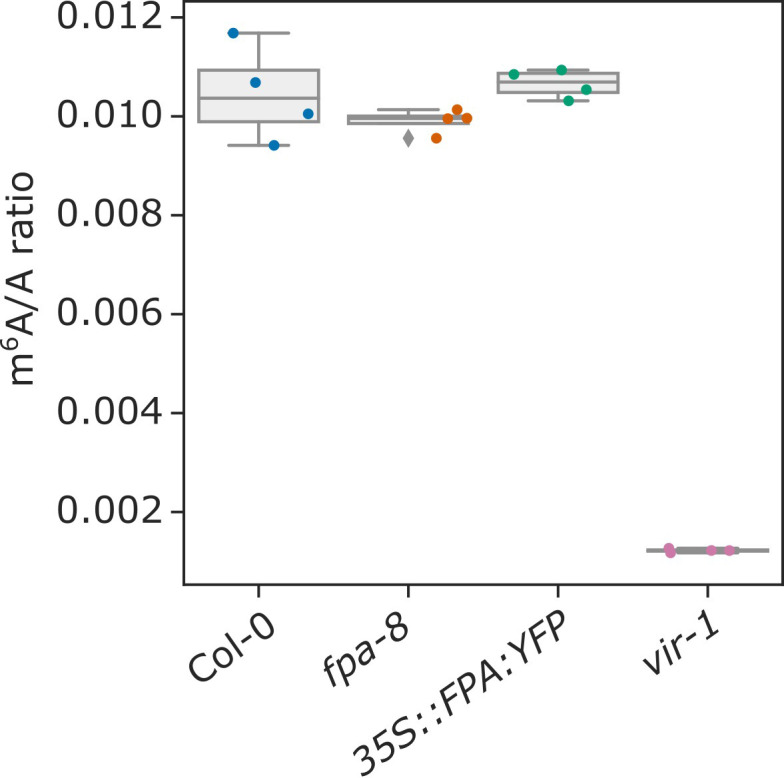
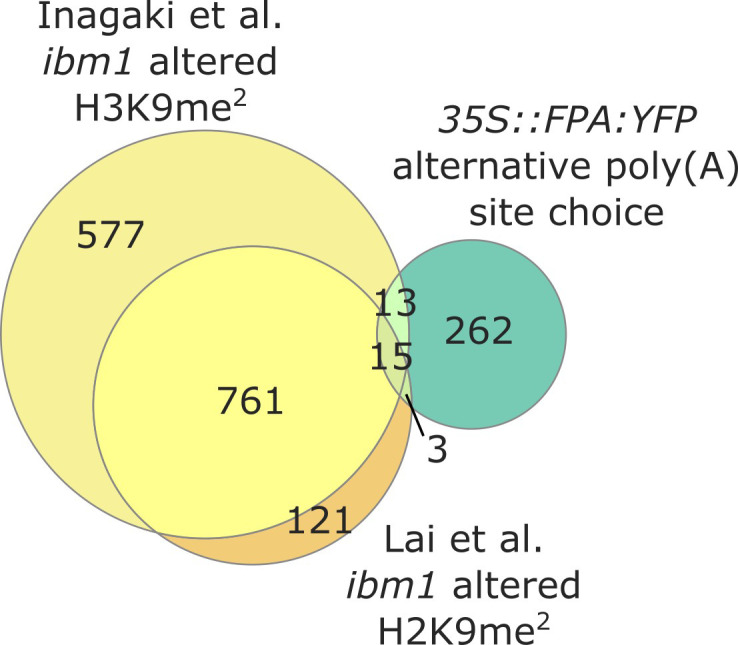
Figure 2—figure supplement 4. FPA-dependent control of NLR expression is independent of IBM1.