
Figure 1.
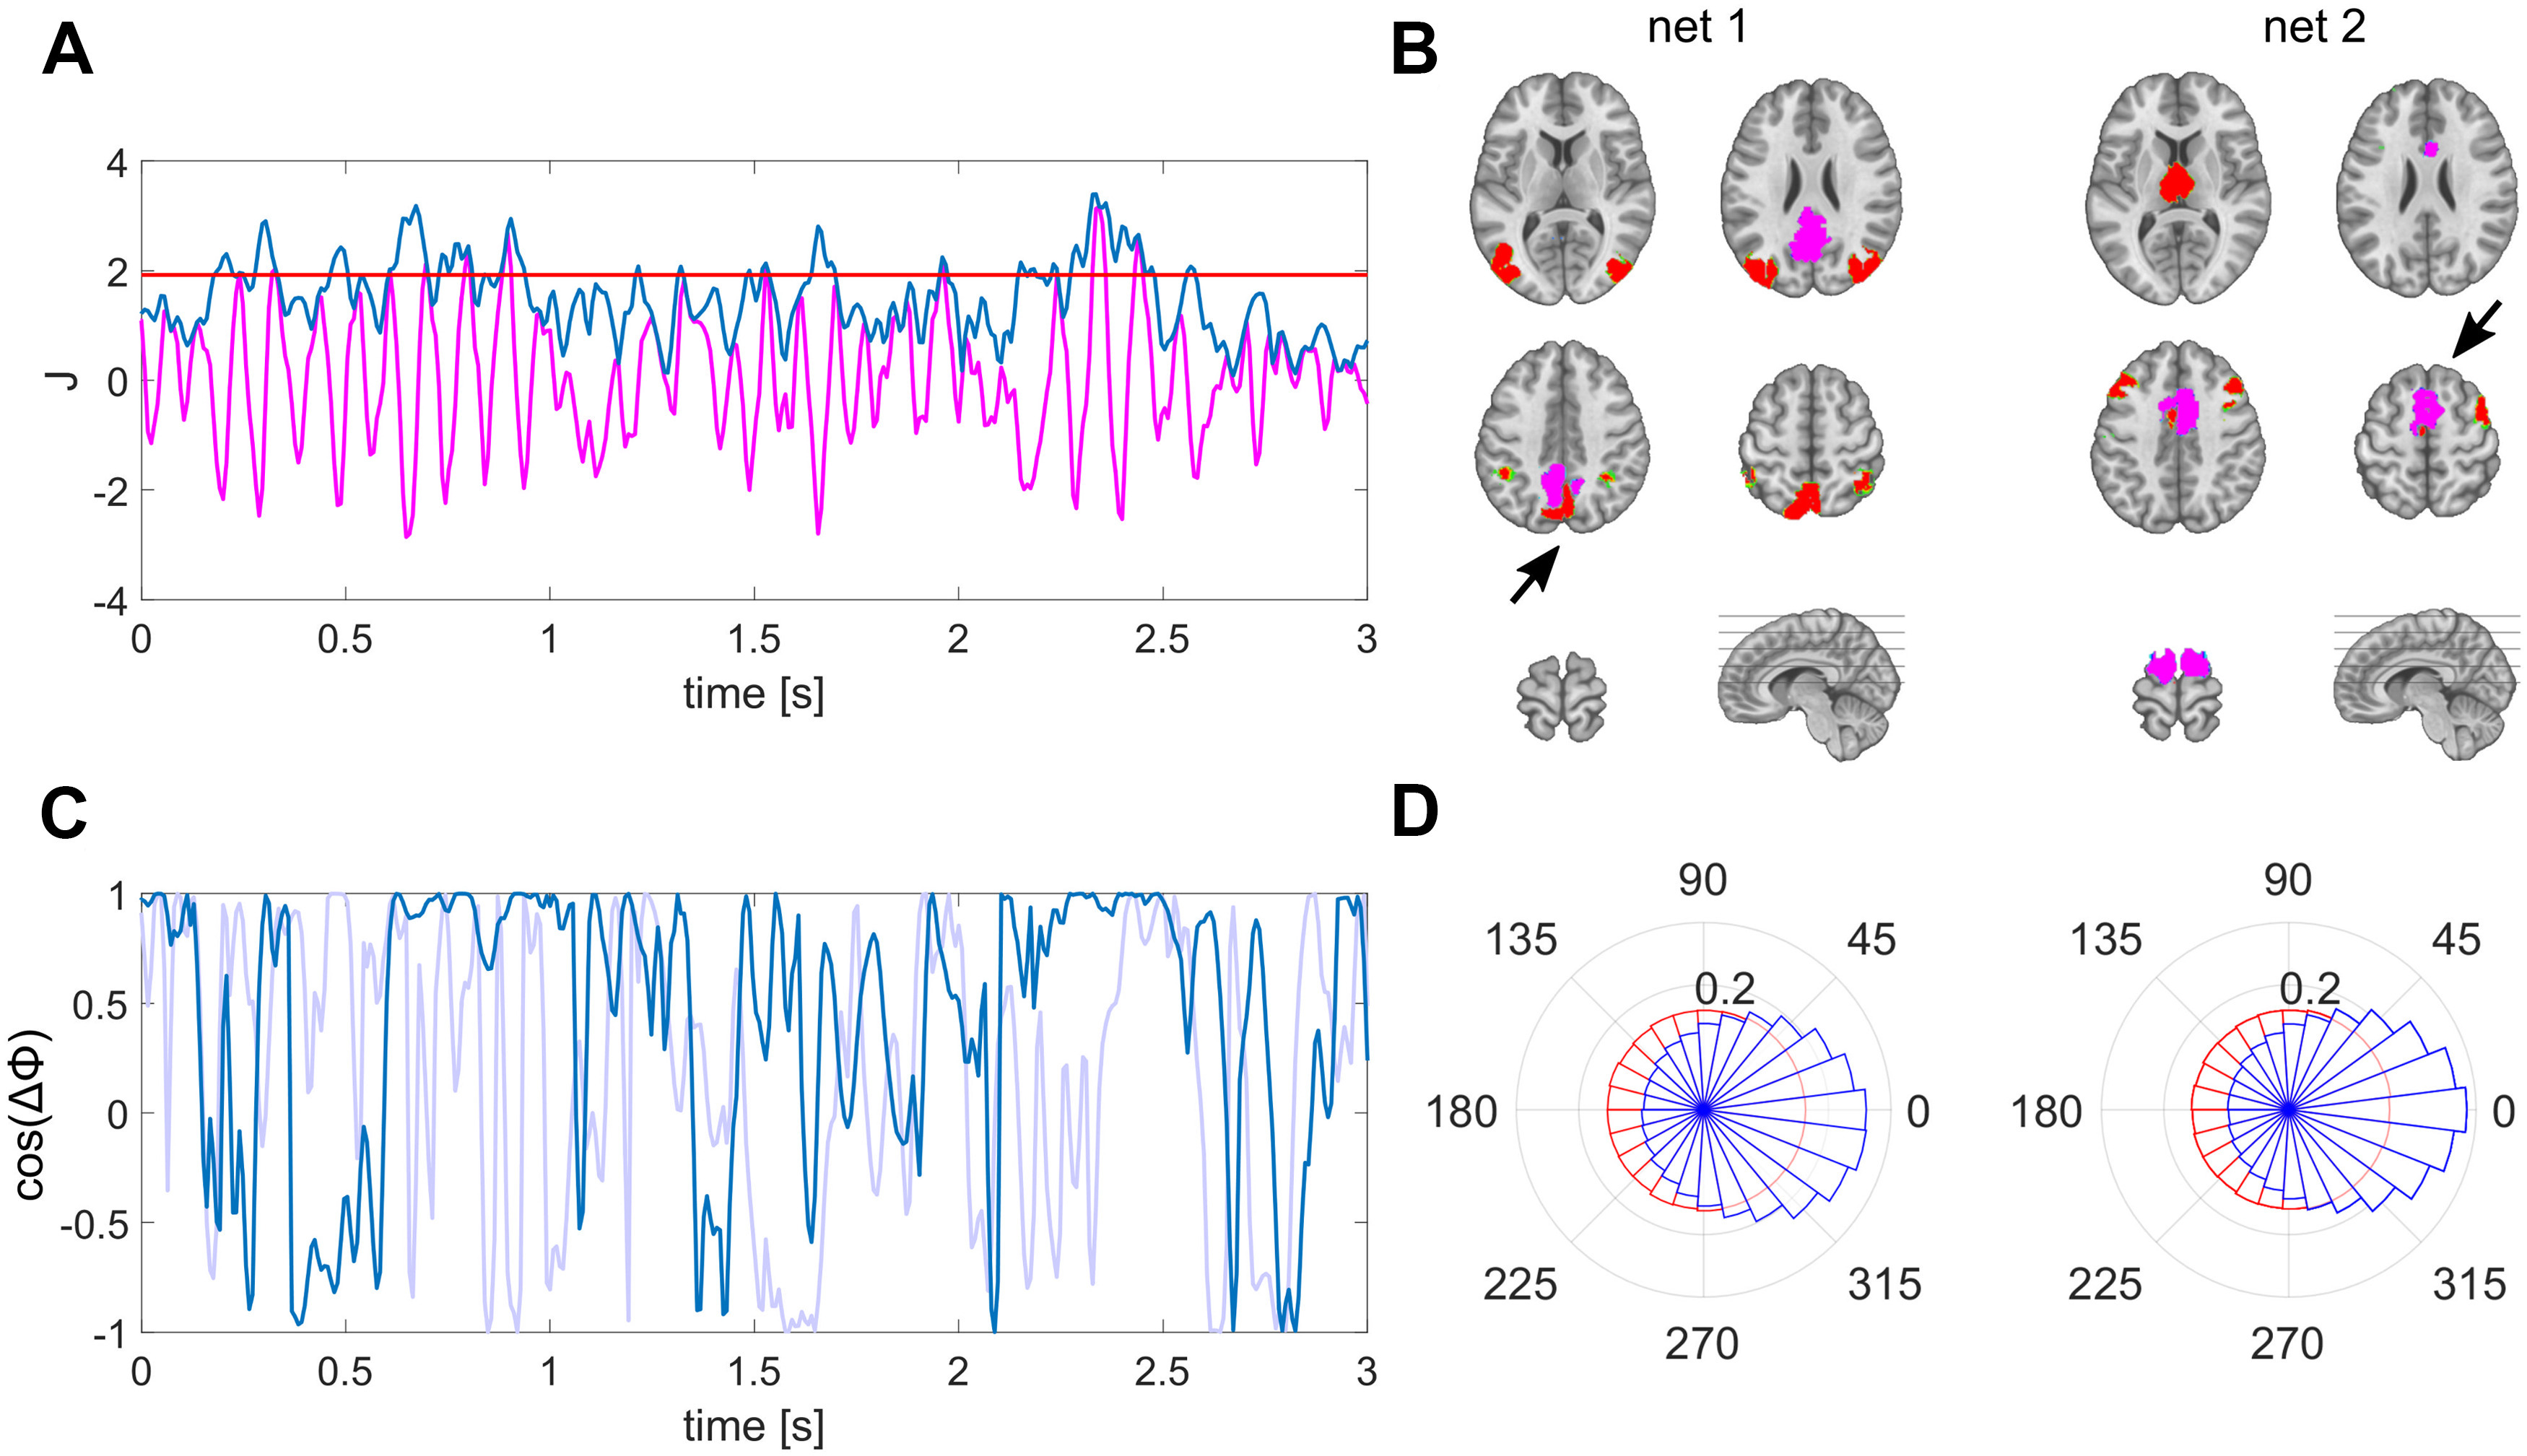
Derivation and characterization of EEG source reconstructed networks. A, The envelope (blue) of source estimated activity (magenta) is thresholded to define periods of well-pronounced activity within a specific ROI (here PCC). B, Nodes of the network (red) co-varying with the PCC (net 1) during periods defined as indicated in A and with the SMA (net 2) as seed ROI (magenta) marked with black arrows. C, Exemplary time course of instantaneous phase locking between lateral posterior regions of net 1, matching the time period shown in A in magenta; surrogate phase locking is shown in light blue. D, Polar histograms of the group, displaying the distribution of interhemispheric phase differences between lateral posterior (net 1) and anterior (net 2) regions as illustrated in B in blue; surrogate phase differences in red. The radius for each phase bin displays the probability density function estimate of the respective phase differences.