
Figure 3.
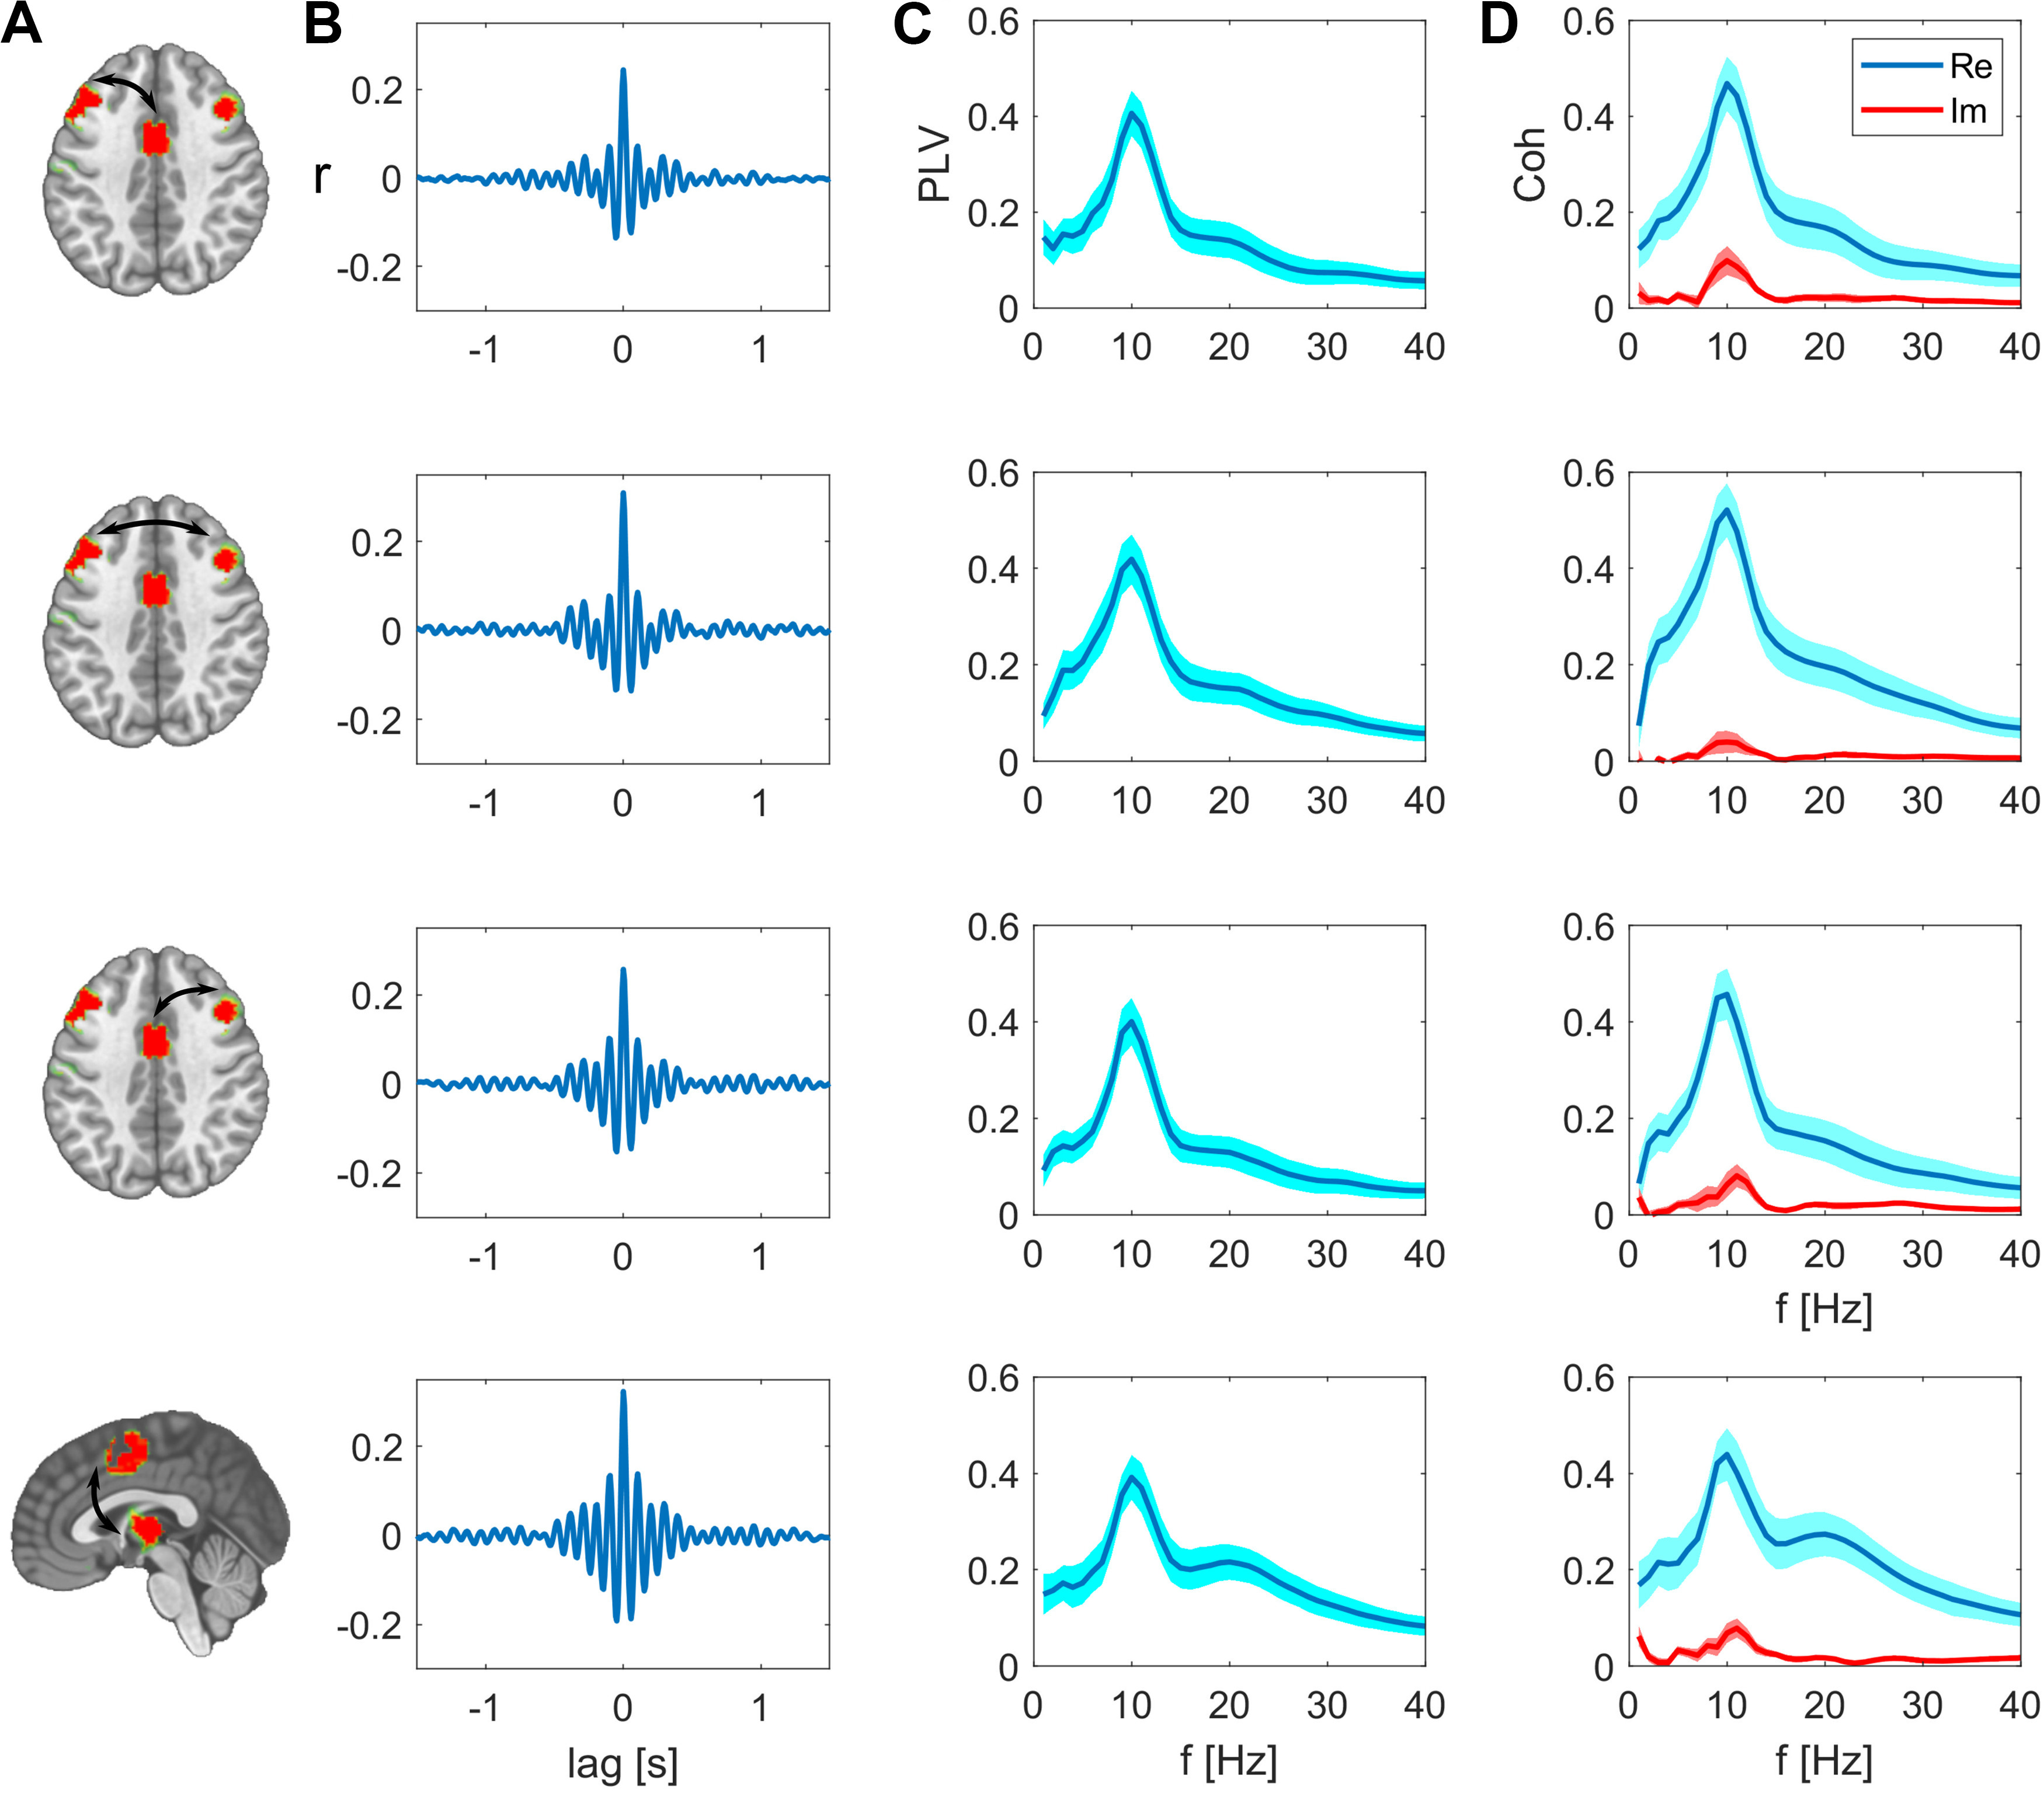
Synchrony between the nodes of the SMA network after subtracting spatial leakage bias. A, Nodes of the network, edges are indicated as arrows. B, Cross-correlations between these two nodes are respectively maximal at zero lag. C, PLV as function of frequency, group mean ± SEM. D, Real and imaginary part of the coherency, group mean ± SEM.