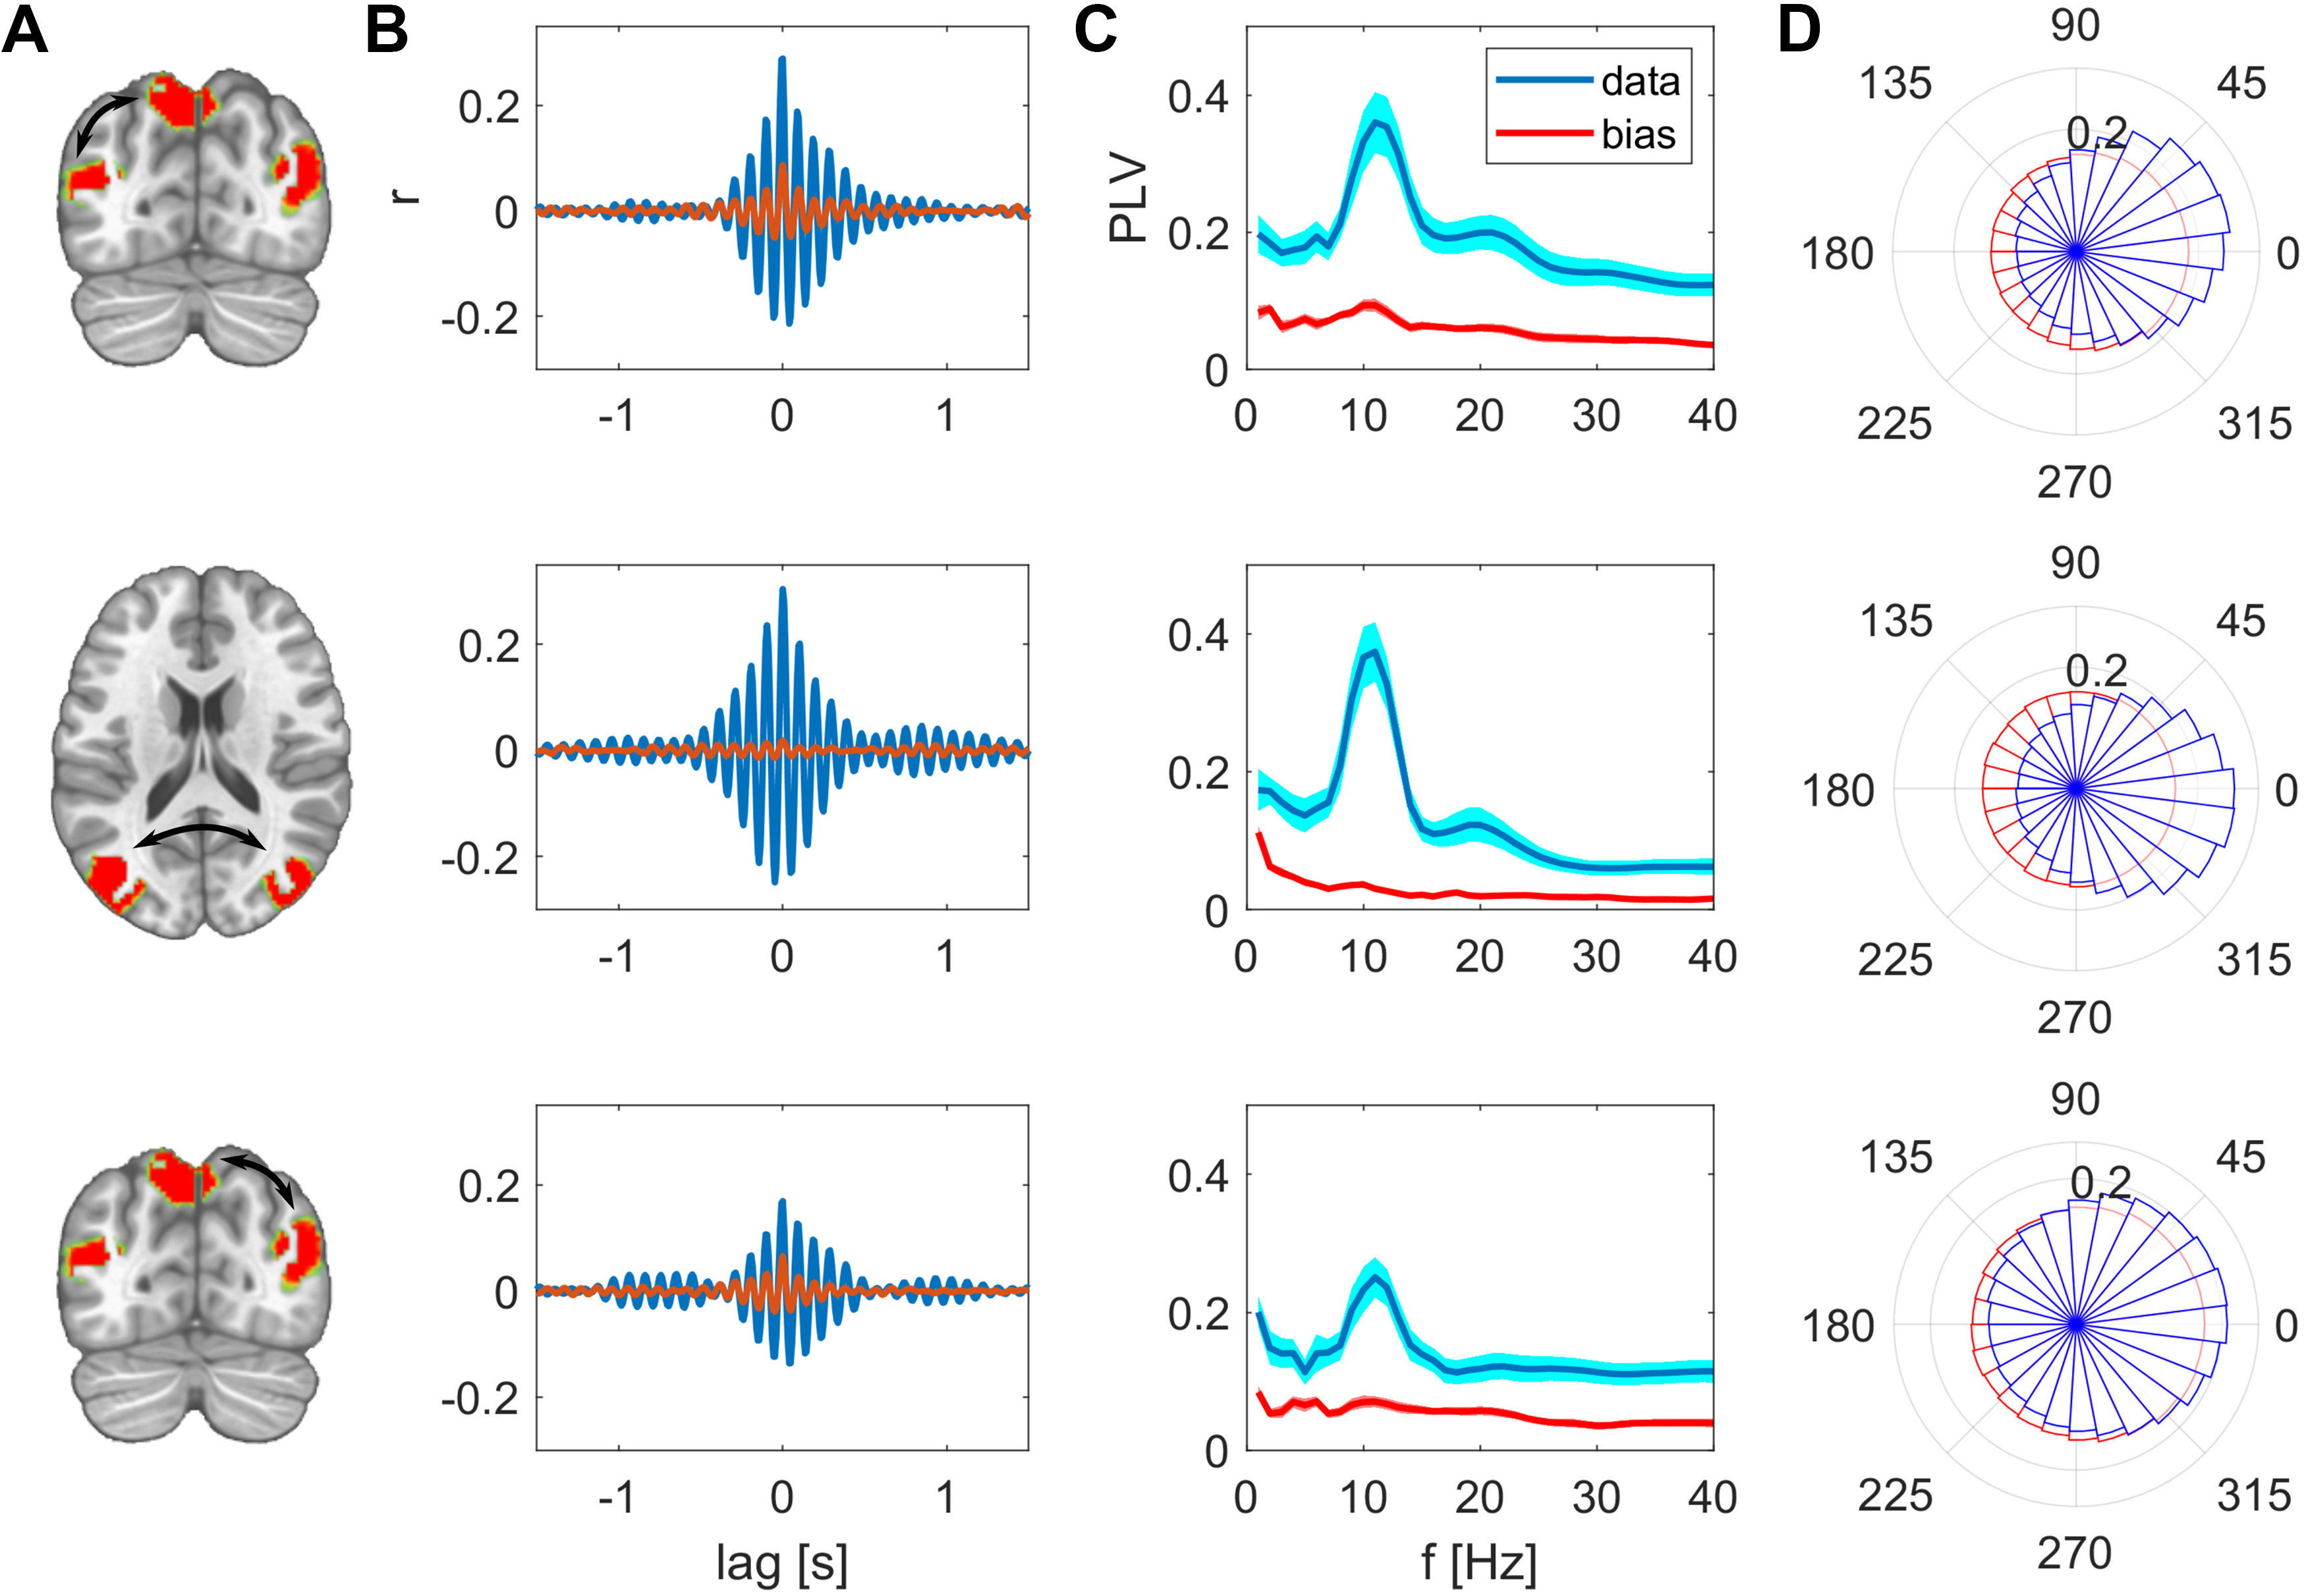
Figure 4.

Synchrony between the nodes of the PPC network, uncorrected measures in comparison to spatial leakage bias. A, Nodes of the network, edges are indicated as arrows. B, Cross-correlation between these two nodes, actual (uncorrected) data are shown in magenta, bias in surrogate data in red. C, PLV as function of frequency, group mean ± SEM. D, Polar histograms showing the distribution of phase differences for actual data in blue and surrogate data in red. The radius for each phase bin displays the probability density function estimate of the respective phase differences.
