Figure 3.
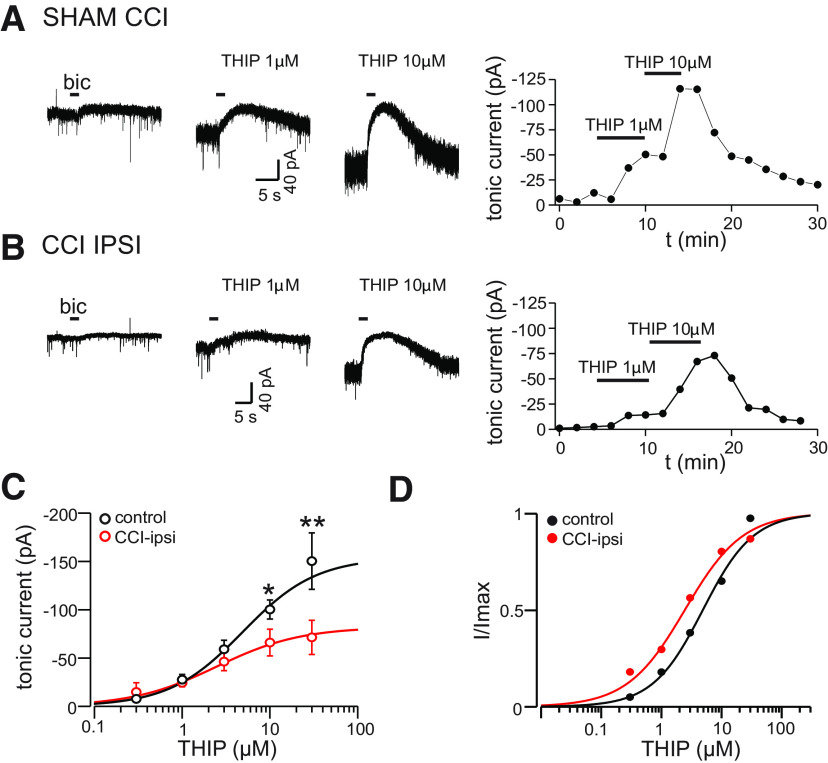
Dose dependence of CCI effects on THIP-induced tonic currents. A, Membrane currents from a sham-treated cell before and during bath application of increasing concentrations of THIP. Right hand panel shows time course of tonic current change for this experiment. B, Membrane currents from a CCI-ipsi cell before and during bath application of THIP, right hand panel shows time course of current change for this experiment. C, Dose–response relationship for THIP-activation of tonic currents in control and CCI-ipsi DGGCs. Data points represent mean ± SEM. CCI reduced current amplitudes with THIP concentrations >3 μm. Solid line is a Hill equation fit to data, the estimated EC50 was 4.9 and 2.5 μm for control and CCI-ipsi cells, respectively. D, Normalized dose response data from C. Data and fitted curves were normalized to maximum value (Imax) for these fits to better illustrate the similar EC50 values. Error bars are omitted for clarity. *p < 0.05, **p < 0.01.

