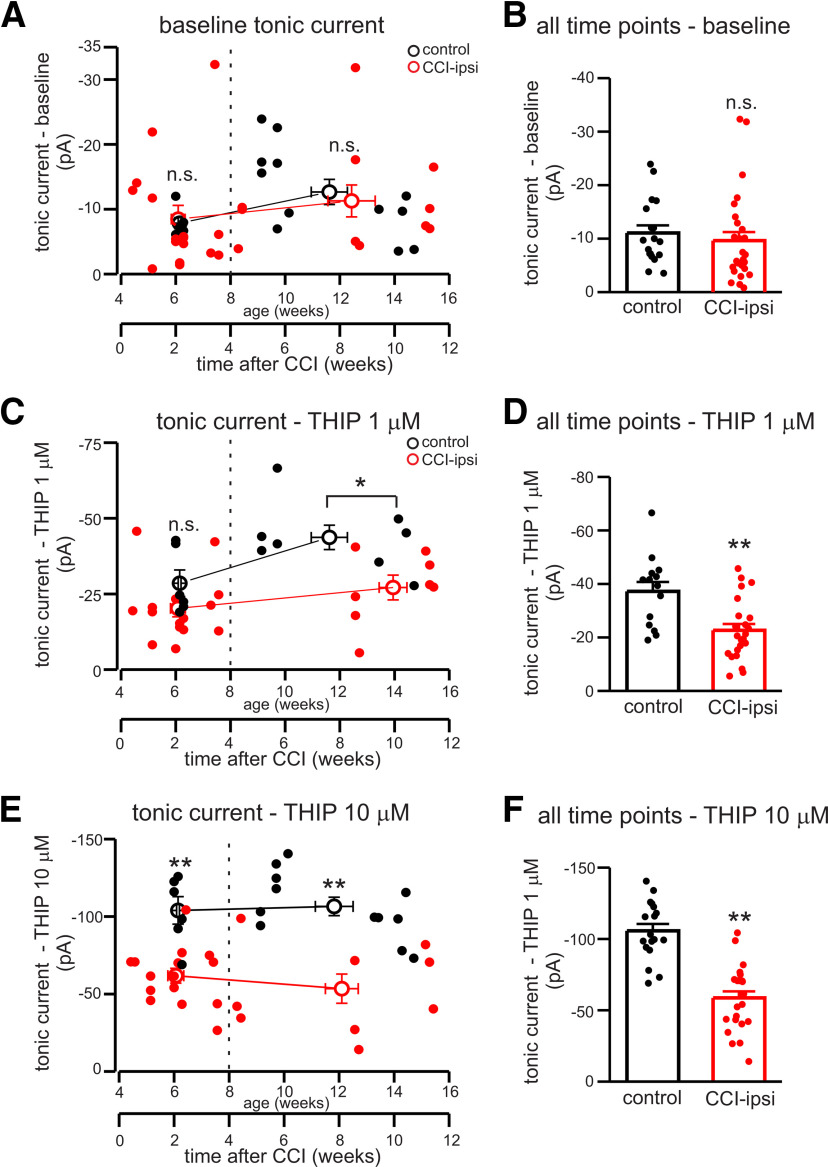
Figure 4.
Time dependence of changes in baseline and THIP-induced tonic currents after CCI. A, Baseline tonic current amplitude as a function of age and time after CCI for control and CCI-ipsi cells. Open circles are mean ± SEM of binned data; data binned into groups of cells less than four weeks after CCI or more than four weeks after CCI (dashed line). Solid circles are measurements from individual control (black) or CCI-ipsi (red) cells. B, Mean ± SEM of basal tonic currents at all time points. C, Time course of THIP-induced (1 μm) tonic currents after CCI for CCI-ipsi cells and age-matched controls. D, Mean ± SEM of tonic currents with 1 μm THIP at all time points. Tonic currents with 1 μm THIP were not significantly different compared with control less than four weeks after injury but significant differences were seen in cells more than four weeks after CCI and in ensemble analysis of all time points. E, Time course of tonic currents induced by THIP (10 μm) after CCI for control and CCI-ipsi cells. n.s., not significant; *p < 0.05, **p < 0.01.

