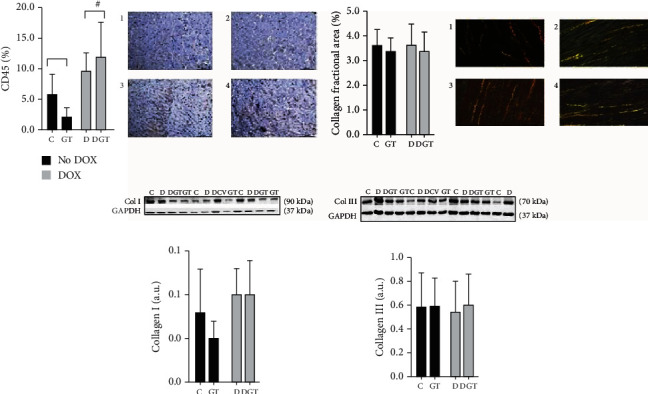
Figure 3.

Inflammatory cells and interstitial collagen fraction. Groups: C: control; GT: green tea; D: doxorubicin; DGT: doxorubicin+green tea. In the microscopic images, animal 1 corresponds to group C; 2, GT; 3, DGT; and 4, D. Col I: collagen I; Col III: collagen III; box and bars are expressed in mean ± standard deviation. Pi: P value of interaction; Pgt: P value of green tea; Pd: P value of doxorubicin. After the statistical analysis using two-way ANOVA, no interactions were observed for these data. CD45: #comparisons without interaction considered the differences between: DOX (D + DGT) ≠ no DOX (C + GT): Pd value < 0,001. Collagen fractional area: Col I, Col III: all the comparisons presented P > 0, 05.
