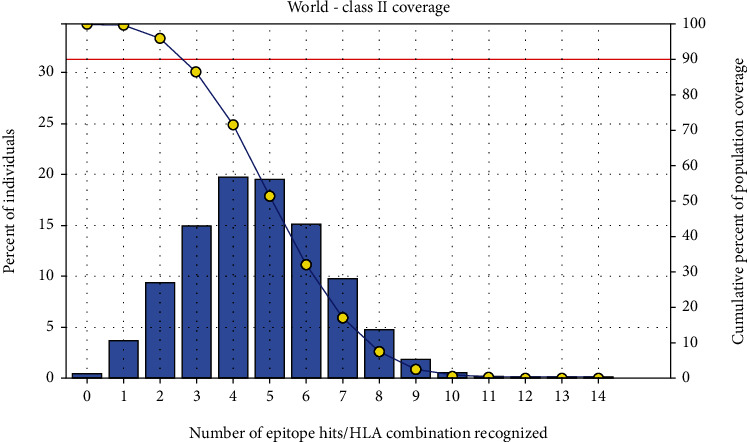
Figure 6.

Global proportion for the top five MHC II IRGSIAAAH, LFSSHMLDL, and VVAALEAAR. Notes: in the graph, the line (-o-) represents the cumulative percentage of population coverage of the epitopes; the bars represent the population coverage for each epitope.
