
Fig. 2.
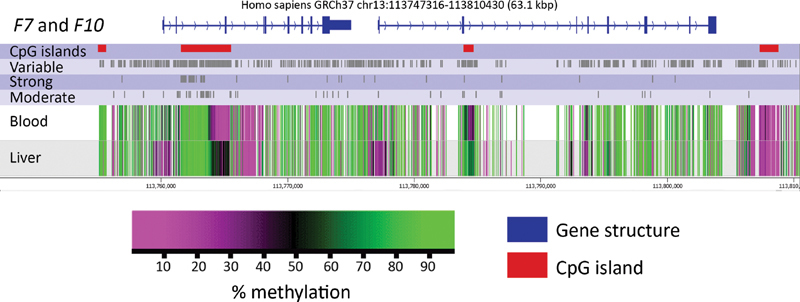
Schematic illustrations of F7 and F10 depicting DNA methylation patterns and location of correlated CpGs in blood and liver tissue. At least 5 kbp upstream and 0.5 kbp downstream of each gene are included: blue indicates the gene structure and red CpG islands. Variable CpGs and those displaying moderate and strong correlations are shown in gray . The average methylation status of the 27 samples for each CpG in blood and liver is also presented; purple represents a low degree of methylation (hypomethylation) and green a high degree of methylation (hypermethylation). All other genes can be found in Supplementary Figure S2 (available in the online version).