
Fig. 2. (A) A snap shot of trajectory and interaction energy at the subsites of Tr Cel7A WT, (B) Effects of tryptophan mutations on the binding free energy.
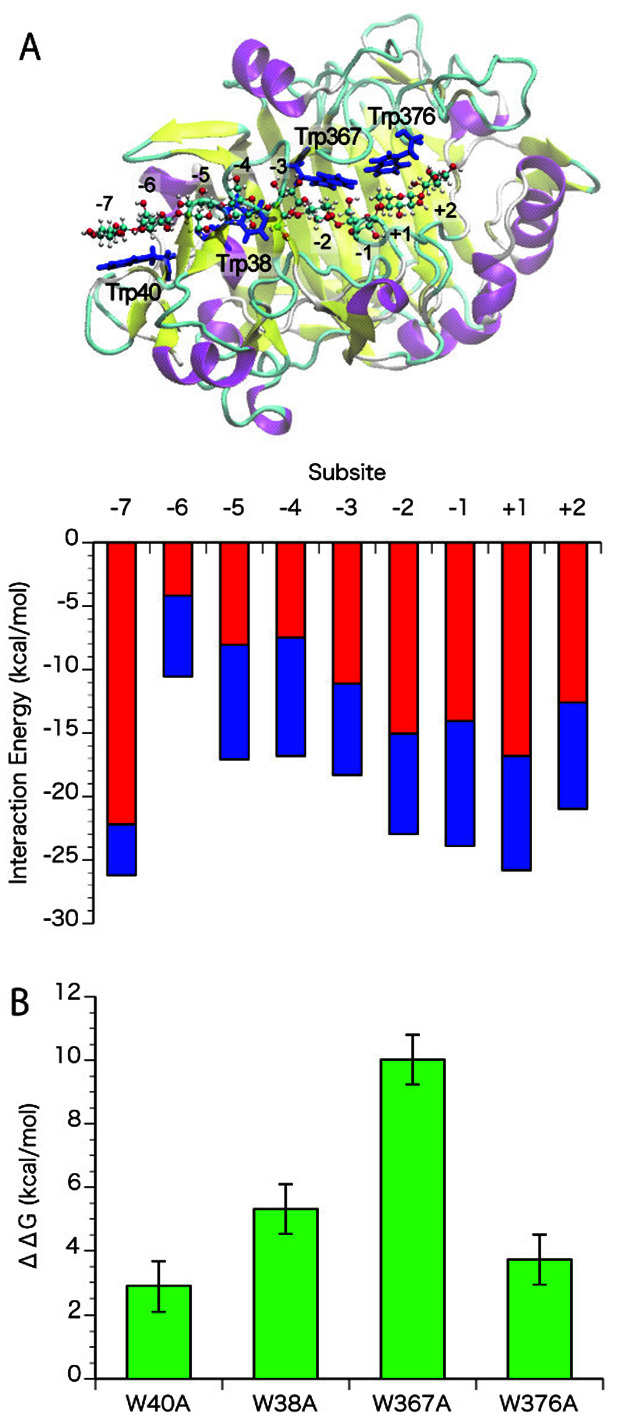
The interaction energy of cellononaose at the subsites in Tr Cel7A was calculated using the liganded structure (PDB ID: 8CEL). The electrostatic and the van der Waals interactions are shown in red and blue, respectively, in Fig. 2A. Standard errors for electrostatic and van der Waals interactions were about 0.4 and 0.1, respectively. The effects of mutation of each tryptophan (Trp40, 38, 367, and 376) to alanine were estimated by alanine-scanning, shown in green in Fig. 2B. Standard errors are shown as bars.