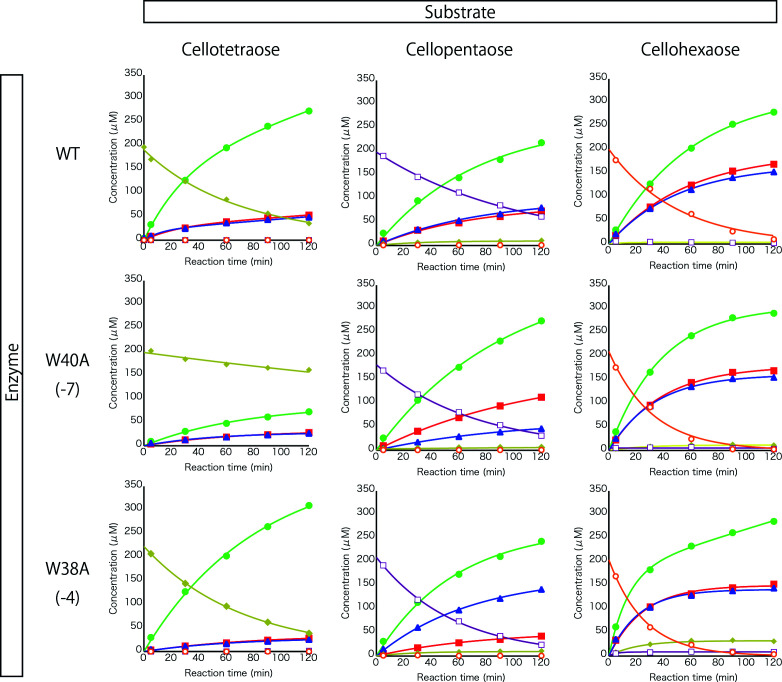
Fig. 4. Time courses of hydrolysis of cello-oligosaccharides (cellotetraose to cellohexaose) by Tr Cel7A WT and the two tryptophan mutants.
Reactions were conducted in 50 mM sodium acetate pH 5.0 at 30 °C. Initial concentration of substrates was 200 µM and enzyme concentrations were 0.1 µM. Filled square: glucose, filled circle: cellobiose, triangle: cellotriose, diamond: cellotetraose, open square: cellopentaose and open circle: cellohexaose.

