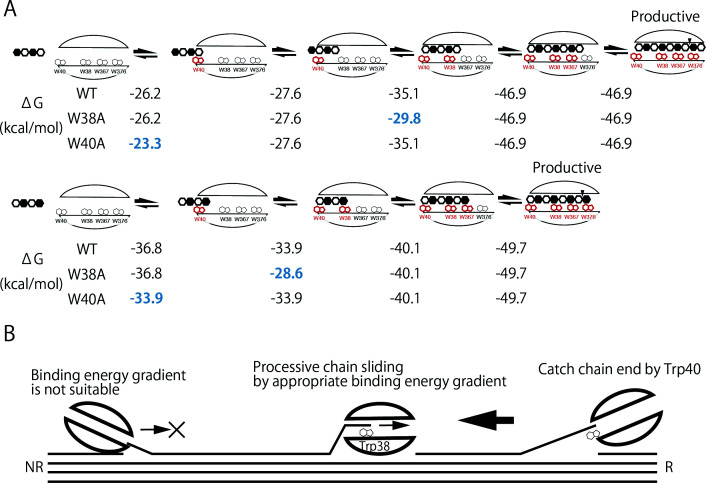
Fig. 7. (A) Differences of binding free energies during cellulose hydrolysis by Tr Cel7A WT and mutants, (B) Scheme of cellulose hydrolysis by Tr Cel7A WT.
Differences of binding free energies was calculated from Fig. 2. Interacting tryptophan residues are shown in red, and unfavorable changes of free energy compared with WT are shown in blue.

