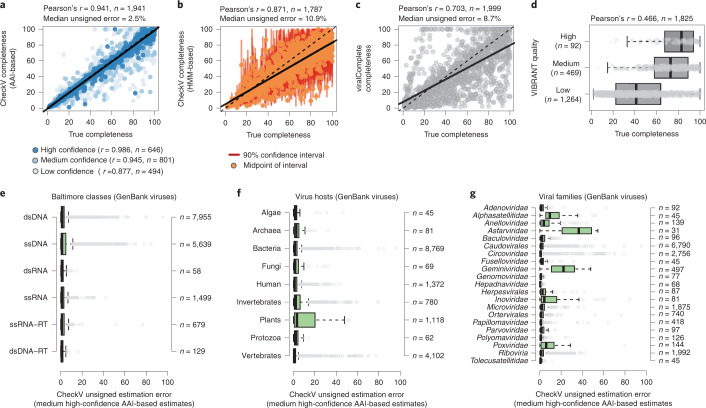
Fig. 3. Benchmarking completeness estimation for CheckV and existing tools.
a–d, Benchmarking completeness for a mock dataset containing fragments from 2,000 complete genomes derived from IMG/VR. Dashed lines represent the line of equality while solid lines indicate best fit. Completeness estimates above 100% were set to 100%. a, CheckV-estimated completeness using the AAI-based approach. Point color depth indicates estimation confidence level. b, CheckV-estimated completeness using the HMM-based approach. Red vertical lines indicate the 90% confidence interval of estimated completeness while points indicate the midpoint of that interval. c, Completeness as estimated by viralComplete, based on the ratio of the contig length to the length of the classified reference genome. d, VIBRANT quality tiers. e–g, Benchmarking CheckV completeness for genome fragments derived from NCBI GenBank genomes. Estimation error is shown for viruses according to their Baltimore classification (e), cellular host (f) and viral family (g). Only medium- and high-confidence AAI-based estimates are shown. Viral categories representing at least 30 viruses are indicated on the vertical axes. For box plots, the middle line denotes the median, the box denotes the IQR and the whiskers denote 1.5× IQR. RT, reverse transcribing; ssDNA, single-stranded DNA.

