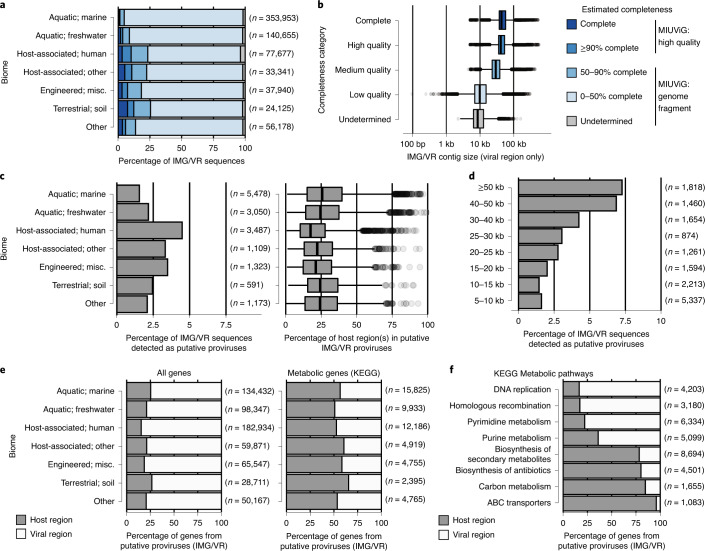
Fig. 5. Application of CheckV to the IMG/VR database.
a, Estimated completeness of IMG/VR contigs by biome. b, Distribution of IMG/VR contig length across quality tiers: complete (n = 13,700), high quality (n = 16,544), medium quality (n = 45,109), low quality (n = 634,117) and undetermined (n = 14,399). For proviruses, only the size of the predicted viral region was considered. c, Proportion of IMG/VR contigs predicted as proviruses by biome (left). Sequences predicted with >50 ambiguous bases (Ns) or potential concatemers were classified as low quality. Putative nonviral sequences in IMG/VR were not included (>5 host genes and >2× host versus viral genes). Length of the predicted host region by biome for IMG/VR contigs predicted as proviruses (right). Region length is indicated as a percentage of total contig length. d, Proportion of contigs predicted as proviruses by contig length. e, Percentage of all genes from predicted proviruses found in viral/host regions (left). Percentage of metabolic genes from predicted proviruses found in viral/host regions (right). f, Percentage of genes from selected KEGG pathways for predicted proviruses found in viral/host regions. For box plots, the middle line denotes the median, the box denotes the IQR and the whiskers denote 1.5× IQR. Misc., miscellaneous.

