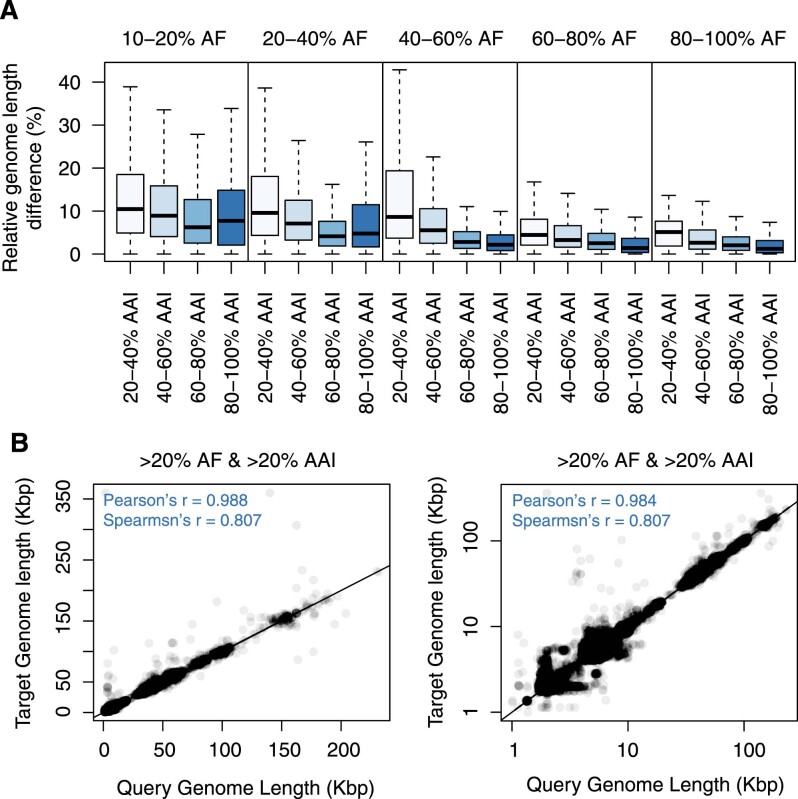
Extended Data Fig. 2. Variation in genome size between viruses.
The relatedness between all CheckV reference genomes was estimated based on their average amino acid identity (AAI) and alignment fraction (AF). For box plots, the middle line denotes the median, the box denotes the interquartile range (IQR), and the whiskers denote 1.5× the IQR. a) The relative difference in genome length for viruses with varying degrees of relatedness. b) Scatterplots showing genome sizes between related viruses. The right panel shows genome sizes on a log10 scale.

