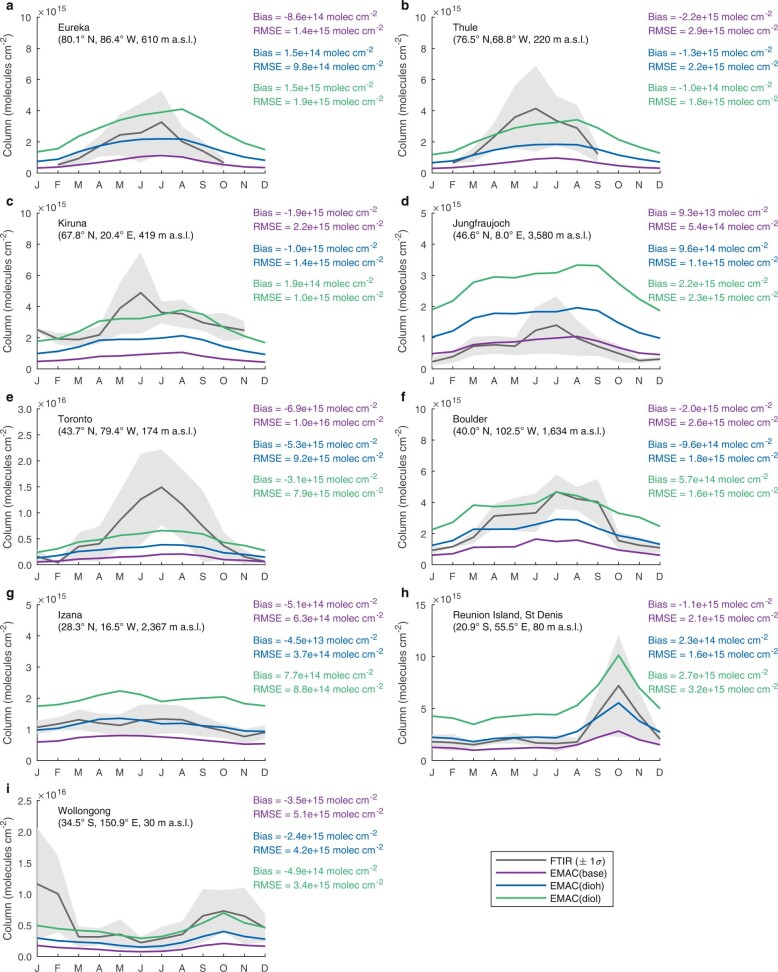
Extended Data Fig. 1. Seasonal cycle of formic acid from FTIR and model.
a–i, Formic acid (HCOOH) monthly average columns at nine different FTIR stations, displayed on a 1-year time base, from the 2010–2012 ground-based FTIR observations and EMAC simulations. The grey shaded areas correspond to the 1σ standard deviation of the individual FTIR measurements around the monthly average. The mean column bias and root-mean-squared error (RMSE) were calculated between the daily mean FTIR and EMAC data, over the days with FTIR measurements available. The vertical sensitivity of the FTIR retrievals was accounted for by applying averaging kernels (except at Wollongong, where no averaging kernels were produced). Details on the ground-based FTIR retrievals are provided in Supplementary Information, section 6. m a.s.l., metres above sea level.

