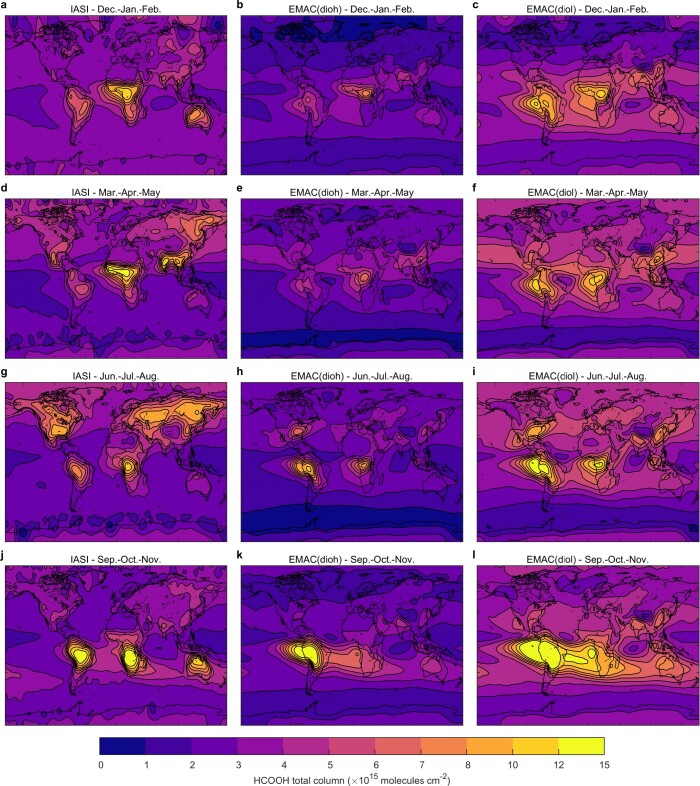
Extended Data Fig. 3. Global formic acid abundance from satellite and model.
a–l, Formic acid (HCOOH) column derived from IASI satellite observations (a, d, g, j), and simulated by the EMAC model that implements the additional production of HCOOH via the multiphase chemistry of methanediol (b, e, h, k, EMAC(dioh); c, f, i, l, EMAC(diol)). Model data were sampled at the time and location of the satellite measurements. The total columns are seasonal averages over December–February (a–c), March–May (d–f), June–August (g–i) and September–November (j–l) 2010–2012. Statistics on the EMAC-to-IASI HCOOH column biases are presented in Extended Data Fig. 4.

