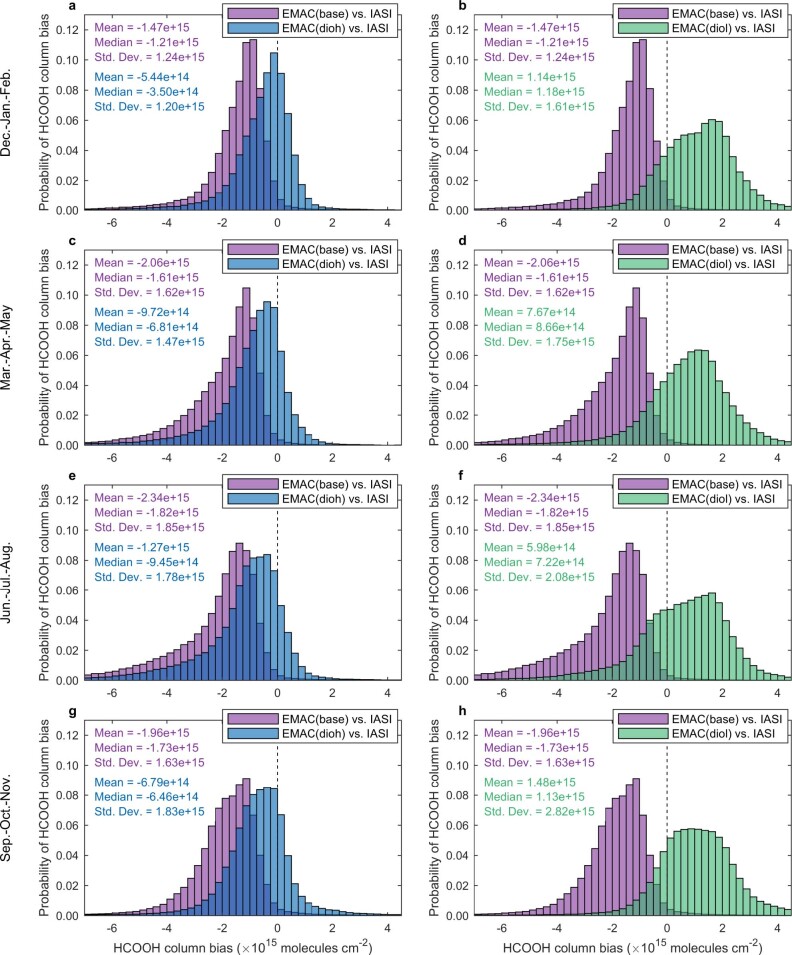
Extended Data Fig. 4. Formic acid column biases between model and satellite.
a–h, Probability histograms of the seasonal formic acid (HCOOH) column bias between EMAC simulations and IASI satellite data over December–February (a, b), March–May (c, d), June–August (e, f) and September–November (g, h) 2010–2012. The statistics correspond to the mean, median and 1σ standard deviation of the column biases calculated between the EMAC and IASI columns for each season. The associated global HCOOH column distributions are displayed in Extended Data Fig. 3.

