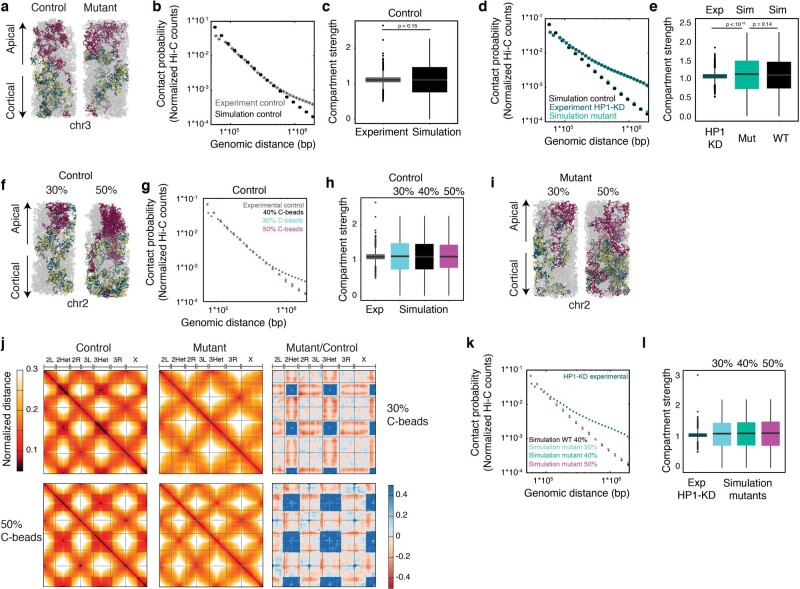
Extended Data Fig. 6. Genome-wide simulations show that loss of HP1 at pericentromeric regions does not cause the phenotype within chromosome arms.
a, Snapshots of control (left) and mutant (decreased interactions between C-type beads and between C-type beads and the nuclear envelope, right) simulations, reproducing the experimental scaling and compartment strength. Colour code as in Fig. 4a. b, Scaling of contact probabilities in experimental and simulated contact maps. c, Simulated and experimental compartment strength. P values determined by two-sided Wilcoxon test. d, Scaling of contact probabilities in experimental HP1-KD and simulated control embryos and mutant contact maps. No differences between simulated control and mutant are detected. e, Experimental compartment strength in HP1-KD and simulated compartment strength in control and mutant samples. No differences between simulated control and mutant are detected. P values determined by two-sided Wilcoxon test. f, Snapshots of the control simulations with different amounts of C-type beads (30% and 50%). A single full chromosome is highlighted in each snapshot. g, Scaling of contact probabilities in experimental and simulated contact maps with different amounts of C-type beads. h, Experimental and simulated compartment strength with different amounts of C-type beads. i, Snapshots of the simulations with decreased interactions between C-type beads and their interaction with nuclear surface. A single chromosome is highlighted in each snapshot. Different amounts of C-type beads (30% and 50% of the total number of beads) are shown. j, Genome-wide simulated distance maps of control (left) and mutant samples with decreased interaction within and between C-type beads and their interaction with nuclear surface (middle). Differential distance map (log2-transformed fold change in mutant versus control) highlighting increased distance within and between centromeric and telomeric regions (right). Different amounts of C-type beads (30% and 50% of the total number of beads) are shown. k, Scaling of contact probabilities in experimental HP1-KD and simulated control and mutant contact maps with different amounts of C-type beads. No differences between simulated control and mutants are detected. l, Experimental compartment strength in HP1-KD and simulated compartment strength in mutants with different amounts of C-type beads. No differences between the simulated mutants are detected. Box plots are as in Fig. 1d.

