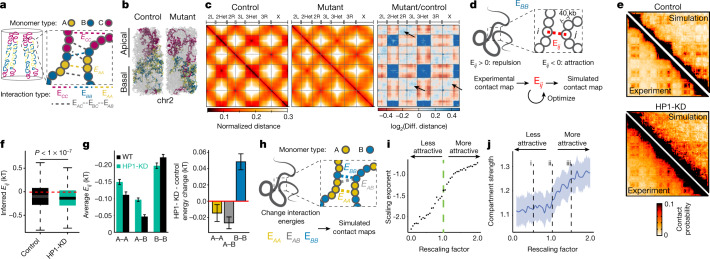
Fig. 4. HP1 establishes de novo chromatin architecture during development via two independent mechanisms.
a, Whole-genome polymer model. A- and B-type beads correspond to 10-kb A- and B-compartment regions. C-type beads correspond to pericentromeric and telomeric regions. b, Snapshots of wild-type control (left) and mutant (right) simulations. c, Genome-wide simulated distance maps of control (left) and mutant (centre). Right, differential distance map highlighting increased distances within and between centromeric and telomeric regions and reduced chromosome arm alignment (arrows). d, Polymer model of multi-megabase chromosome arm regions. Interaction energies between 40-kb beads are inferred to reproduce the experimental Hi-C map. e, Experimental and simulated contact maps in control (top) and HP1-KD (bottom) embryos (chr3R 17–20.6 Mb). f, Inferred interaction energies are overall more attractive in the HP1-KD model. P value determined by two-sided Wilcoxon test. Box plots are as in Fig. 1d. g, Left, interaction energies between B-type beads (B–B) become comparatively less attractive in HP1-KD embryos, but more attractive between A-type beads (A–A) and between A and B types (A–B). Right, average interaction energy changes between HP1-KD and control models. B-compartment attractions decrease in the HP1-KD model. Data are mean ± s.e.m., interactions: 990 (A–A), 2,069 (A–B), 1,035 (B–B). h, Chromatin is modelled as a chain of two types (A and B) of interacting 40-kb beads (chr3R 17–20.6 Mb). i, Scaling exponents increase when attractions between all beads are increased by a multiplicative factor, and vice versa. j, Compartment strength (bold line: mean) decreases when attractions between beads are increased, and vice versa. Confidence interval (shaded area) calculated using t-based approximation.

