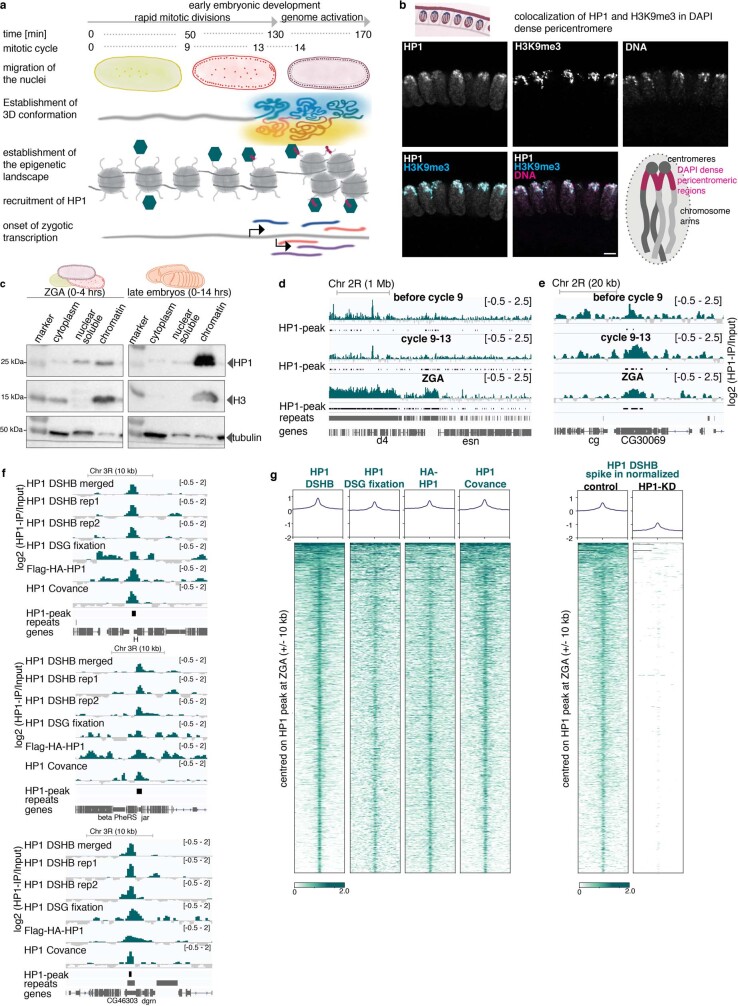
Extended Data Fig. 1. Characterization of HP1 binding during early embryonic development.
a, Cartoon of early Drosophila developmental timing showing the onset of genome organization, chromatin modifications and transcription. b, Immunofluorescence staining of an embryo at ZGA. H3K9me3 and HP1 are enriched at the pericentromeric heterochromatin (clustering on top and corresponding to the DAPI dense signal; see cartoon). Representative image from four biological replicates. Scale bar, 5 μm. Quantification of the immunofluorescence signal shows that HP1 intensity is 30 times higher in the pericentromeric regions (co-localizing with H3K9me3) than in the rest of the nucleus. Average signal of 300 nuclei from 2 independent experiments. c, Cellular fractionation of embryonic extracts at 0–4 h (corresponding to ZGA) of development and from late embryos (corresponding to gastrulation and segmentation). HP1 is already detectable in the chromatin fraction at 0–4 h and becomes further enriched during differentiation. Representative of two independent experiments. For western blot source data, see Supplementary Fig. 1. d, e, Representative genomic regions showing HP1 signal as log2-transformed fold change over the input before cycle 9, between cycle 9–13 and at ZGA by ChIP–seq. HP1 peaks and repetitive sequences (UCSC RepeatMasker) are represented below. d, Strong enrichment of HP1 close to the pericentromeric heterochromatin. e, One euchromatic HP1 binding region. f, IGV browser snapshots of different genomic regions showing HP1 binding in euchromatin regions. We validated the HP1 ChIP–seq by performing replicate experiments with the same antibody from DSHB (rep1 and rep2). All further tracks in this Article show the merged track (top). To further validate our findings, we mapped the binding of HP1 by performing ChIP–seq against a Flag-haemagglutinin (HA)-tagged transgene and used a second commercial antibody (Covance) and detected the same peaks. We also used disuccinimidyl glutarate (DSG) as crosslinking agent to recover more extended regions of HP1 binding and obtained a similar result of HP1 binding. g, Heat maps of HP1, ChIP–seq signals ± 10 kb centred on HP1 peaks occurring along the chromosome arms at ZGA. We validated the binding profiles by performing ChIP–seq against HP1 with different antibodies (DSHB, HA, Covance) and also used the crosslinker DSG (left). To further validate the peaks within chromosome arms, we performed quantitative ChIP–seq in the HP1-KD background, using λ-DNA spike-in as normalizer. The HP1 signal is strongly reduced at HP1 peaks within chromosome arms at ZGA (right). See Supplementary Methods for further details.

