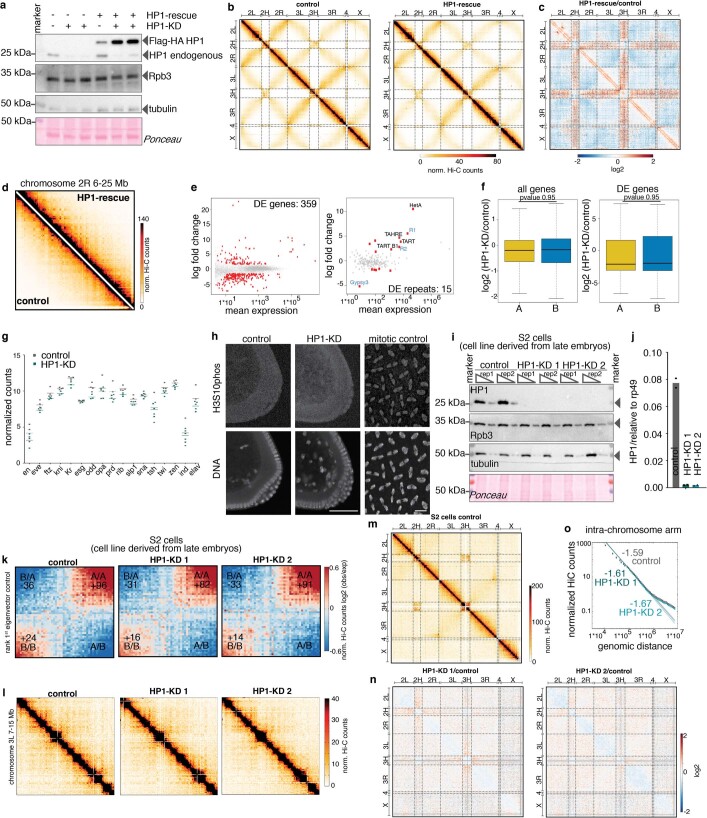
Extended Data Fig. 4. Characterization of HP1 rescue, transcriptomic changes after HP1 knockdown and its effect on 3D genome organization in differentiated S2 cells.
a, Western blot showing the expression of the Flag-HA-tagged HP1 transgene in the background of control and HP1-KD embryos. Rpd3, tubulin and Ponceau were used as loading controls. After depletion of endogenous HP1, the expression of the transgene is increased. Blots are representative of two independent experiments. For western blot source data, see Supplementary Fig. 1. b, Genome-wide Hi-C contact maps in control (left) and HP1-rescue (right) embryos (40-kb resolution). The HP1-rescue and HP1-KD embryos show an inversion on chromosome 2L. c, Genome-wide differential Hi-C contact maps (log2-transformed fold change) in HP1-rescue versus control embryos. The HP1-rescue construct reverses the structural effects of HP1-KD (reduced contact frequency between the pericentromeric regions, as well as inter-chromosome arm interactions and compaction defects). d, Same genomic region as in Fig. 3c, d, with control and HP1-KD embryos expressing HP1-rescue. e, Left, MA plot illustrating differential expression of genes at zygotic genome activation in HP1-KD versus control embryos. In total, we detected 359 differentially expressed genes using RNA-seq (red dots) (Supplementary Methods) (of the total 277 genes are in A-compartment, 72 genes are in the B-compartment regions and 10 genes are on chrUn_CP007120v1). Right, MA plot showing the differential expression of types of repeat. We detected 15 differentially expressed repeat types, highlighted in the plot (Supplementary Methods). f, Box plot showing the distribution of gene expression changes within A- and B-compartments. We did not detect any differences in the distribution of gene expression changes in A- and B-compartments either considering all genes (left, P = 0.95, one-sided Wilcoxon test) or only significant differentially expressed genes (right, P = 0.95, one-sided Wilcoxon test). Box plots are as in Fig. 1d; outliers not shown. g, Expression of a panel of 17 purely zygotically expressed transcription factors in control and HP1-knockdown embryos. In unfertilized eggs all factors are not expressed and become upregulated at zygotic genome activation. The expression of the zygotic transcription factors confirms that HP1-KD embryos undergo zygotic genome activation. Each dot represents the normalized counts for a given transcription factor of a replicate RNA sequencing (RNA-seq) experiment. h, Immunofluorescence staining of control and HP1-KD embryos at zygotic genome activation with the mitosis marker H3S10 phosphorylated. Until the cellular blastoderm stage (ZGA), all nuclei undergo mitosis synchronously and then enter G2 phase at ZGA. The ratio of mitotic cells and the timing of mitosis is not altered in HP1-KD embryos. Scale bar, 50 μm. As a control for antibody specificity, an earlier stage of embryogenesis (before ZGA) was stained showing a strong H3S10phospho signal after synchronous entry into mitosis (right). Representative images from three biological replicates. Scale bar, 10 μm. i, Western blot showing the reduction of HP1 after treatment with double-stranded RNA (dsRNA) treatment in S2 cells (cell culture cells derived from a primary culture of late-stage (20–24 h old) Drosophila embryos, probably from a macrophage-like lineage). Rpd3, tubulin and Ponceau were used as loading controls. To control for unspecific effects of the dsRNA treatment, control cells were treated with a dsRNA against glutathione S-transferases (GST) and two different dsRNAs were used to deplete HP1. Representative of two independent experiments. For western blot source data, see Supplementary Fig. 1. See Supplementary Methods for further details. j, qPCR analysis showing the reduction of HP1 mRNA after dsRNA treatment in S2 cells. The signal is relative to rp49. To control for unspecific effects of the dsRNA treatment, control cells were treated with a dsRNA against GST and two different dsRNAs were used to deplete HP1. See Supplementary Methods for further details. Data are mean of two independent experiments. k, Hi-C contact enrichment in control (left) and HP1-KD (right) in S2 cells, sorted by compartment score, showing no decrease in B-compartment contacts after depletion of HP1 with either dsRNA. This indicates that HP1 is required for the establishment of the B-compartment during early embryonic development but does not affect the maintenance of compartmentalization in late differentiated cells. l, Hi-C contact frequencies of a 19-Mb region on chromosome 3L at a resolution of 120 kb. Pooled Hi-C data of two biological replicates are shown. m, Genome-wide Hi-C contact map in control S2 cells (120-kb resolution). n, Genome wide differential Hi-C contact maps (log2-transformed fold change) in HP1-KD versus control S2 cells. The differential contact maps show the HP1-KD with two independent shRNA on the left and right, respectively. o, Contact probabilities over the genomic distance of control and HP1-KD S2 cells. The contact probability of the HP1-KD cells closely resembles the control. Pericentromeric regions were excluded from the analysis of contact probabilities (Supplementary Methods).

