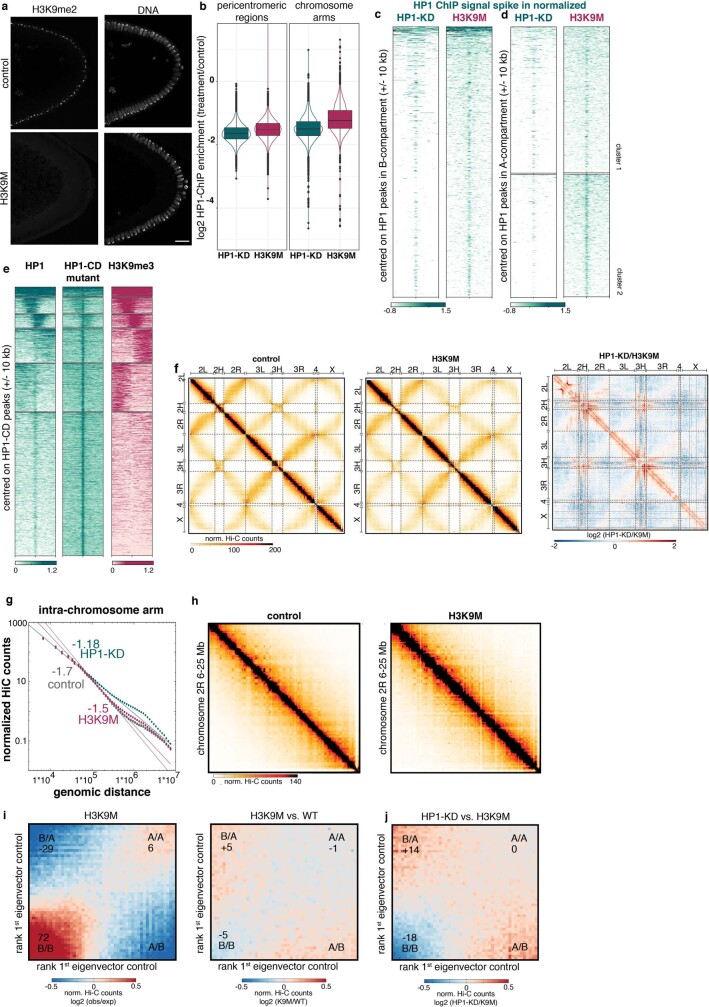
Extended Data Fig. 5. Characterization of H3K9M.
a, Immunofluorescence staining of embryos at ZGA showing that H3K9me2 is completely lost after expression of the H3K9M mutant. H3K9M depletes H3K9me2/3 from chromatin, and acts as a competitive inhibitor of the histone methyltransferases. Representative image from three biological replicates. Scale bar, 20 μm. b, Box plot showing the reduction of the HP1 ChIP–seq signal over the control embryos at ZGA at HP1 peaks in HP1-KD (green) and H3K9M (red) embryos. The signal is reduced overall in HP1-KD embryos, with more loss in the pericentromeric region (left) compared to chromosome arms (right). For comparison, quantitative ChIP–seq data using spike-in normalization has been used. Box plots are as in Fig. 1d. c, Characterization of HP1 binding in B-compartment regions after HP1 knockdown (left) and H3K9M overexpression (right). Heat maps of HP1 ChIP–seq signals are ±10 kb centred on HP1 peaks and show that HP1 is retained at a higher level in H3K9M embryos compared to the HP1-KD embryos. Spike-in normalization has been used to quantify the enrichment. d, As in c, but in A-compartment regions. e, Characterization of HP1 binding in ovaries. Left, binding of a control HP1–Flag-HA-tagged transgene. Middle, binding of a Flag-HA-tagged chromodomain mutant of HP1 (HP1-CD) that cannot bind to H3K9me2/3. Right, the enrichment of H3K9me3 in ovaries. The heat maps of HP1 ChIP–seq signals are ± 10 kb centred on HP1 peaks called in the HP1 chromodomain mutant. f, Genome-wide Hi-C contact maps in control (left) and H3K9M (middle) embryos (120-kb resolution, pooled Hi-C data of two biological replicates). Right, differential Hi-C contact map (log2-transformed fold change in HP1-KD versus H3K9M), highlighting milder compaction within arms in H3K9M with respect to HP1-KD. g, H3K9M shows decay of contact probability similar to control embryos within arms. This suggests that compaction in the H3K9M mutant is milder than in HP1-KD embryos. h, Hi-C contact maps on chr2R (6–25 Mb) in control and H3K9M embryos (120-kb resolution). i, Hi-C contact enrichment in H3K9M (left) and differential Hi-C contact enrichment in H3K9M versus control (right) in embryos, sorted by compartment score showing no decrease in B-compartment contacts upon H3K9M expression. j, Differential Hi-C contact enrichment in HP1-KD versus H3K9M Hi-C maps, sorted by compartment score. B-compartment interactions are more strongly decreased in HP1-KD embryos than in H3K9M embryos.

